- How to add a JavaScript library’s dependencies to a {shiny} application
- How to call JavaScript code from R
TL;DR
Table of Contents
- Creating interactive charts that go beyond the usual dataviz produced in R is possible by integrating a JavaScript library!
-
- We use the example of Chart.js, a very popular JavaScript dataviz library
- Specificities related to integrating Chart.js into a
{shiny}application are addressed, including passing data from R to JavaScript and the differences in expected data formats. - We’ll see how to make sure our JavaScript code is working properly by using the web browser’s console.
Importing Chart.js into a {shiny} app created with {golem}
- Chart.js is a JavaScript library that allows you to create many types of charts (bars, lines, radar, etc.) and customize them as you wish
- It is very well documented
- It is the most popular JavaScript dataviz library on GitHub (over 60,000 “stars” at the time of this article’s publication)
Add the dependencies to Chart.js in your {shiny} app
The following sections assume that you have already created a{shiny} app with {golem}.
If this is not the case and you want to learn more about {golem}, I invite you to consult the official documentation.
To add Chart.js to your {shiny} app, you will need to find a way to incorporate the necessary files for its operation into your application. As we saw in our previous article, two solutions are possible.
- Use a “CDN” (Content Delivery Network) to load the files from a third-party server.
- Download the necessary files and integrate them directly into the application.
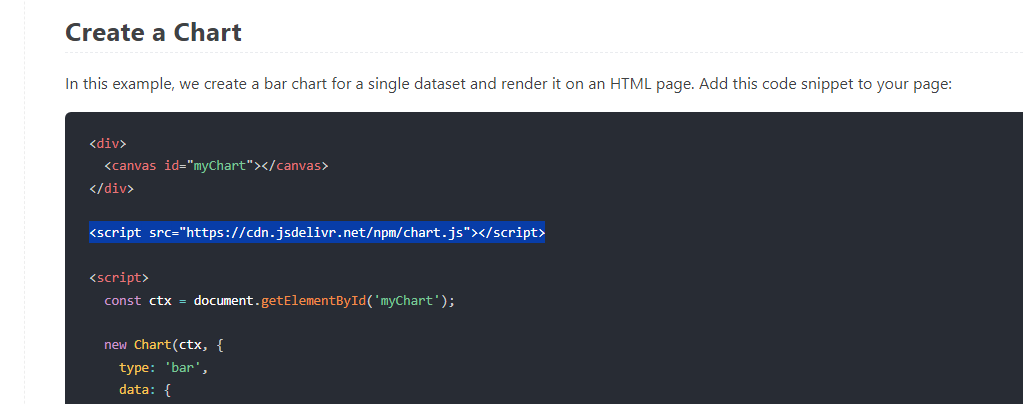 We retrieve the CDN URL and store this information for later use.
After creating the skeleton of an application via
We retrieve the CDN URL and store this information for later use.
After creating the skeleton of an application via {golem}, we will add the Chart.js dependency.
Let’s open the R/app_ui.R file of our application and add the link we copied earlier into the body of the golem_add_external_resources() function.
golem_add_external_resources <- function() {
  add_resource_path(
    "www",
    app_sys("app/www")
  )
  tags$head(
    favicon(),
    bundle_resources(
      path = app_sys("app/www"),
      app_title = "chartJS"
    ),
    # Add here other external resources
    # for example, you can add shinyalert::useShinyalert()
    # Chart.js
    tags$script(src = "https://cdn.jsdelivr.net/npm/chart.js")
  )
}
How to know if Chart.js is properly imported ?
The “Getting Started” section previously consulted to retrieve the CDN link indicates that it is necessary to incorporate the HTML<canvas> tag into our application to display a Chart.js chart. We add this element to the R/app_ui.R file of our application.
app_ui <- function(request) {
  tagList(
    # Leave this function for adding external resources
    golem_add_external_resources(),
    # Your application UI logic
    fluidPage(
      h1("golemchartjs"),
      tags$div(
        tags$canvas(id="myChart")
      )
    )
  )
}golem::run_dev(), and the rest will take place in the web browser.
NB: The following screenshots were taken using the Google Chrome browser.
In the window of our application, right-click and then select “Inspect”. In the new window that opens, choose the “Console” tab and type the command to generate a Chart.js chart, as indicated once again in the “Getting Started” section between the HTML script tags.
The code to copy and paste into the console is the following:
  const ctx = document.getElementById('myChart');
  new Chart(ctx, {
    type: 'bar',
    data: {
      labels: ['Red', 'Blue', 'Yellow', 'Green', 'Purple', 'Orange'],
      datasets: [{
        label: '# of Votes',
        data: [12, 19, 3, 5, 2, 3],
        borderWidth: 1
      }]
    },
    options: {
      scales: {
        y: {
          beginAtZero: true
        }
      }
    }
  });
The chart from the demo page appears as expected! 🎉
We can move on! 😊
The application code for this step is available here: https://github.com/ymansiaux/golemchartjs/tree/step1
The chart from the demo page appears as expected! 🎉
We can move on! 😊
The application code for this step is available here: https://github.com/ymansiaux/golemchartjs/tree/step1
Creating a Bar Chart with Chart.js
The code used previously allowed us to verify that Chart.js was properly imported into our application. Now, we will see how to create a Chart.js chart from our{shiny} application. The goal is to produce bar charts for various datasets with customizable options based on user choices.
Let’s revisit the code executed previously:
  const ctx = document.getElementById('myChart');
  new Chart(ctx, {
    type: 'bar',
    data: {
      labels: ['Red', 'Blue', 'Yellow', 'Green', 'Purple', 'Orange'],
      datasets: [{
        label: '# of Votes',
        data: [12, 19, 3, 5, 2, 3],
        borderWidth: 1
      }]
    },
    options: {
      scales: {
        y: {
          beginAtZero: true
        }
      }
    }
});labels, label, data, and borderWidth elements as function parameters.
Let’s go! 🚀
Creating a JavaScript code usable from R
We saw in our previous article that the way to call JavaScript code from R is to use a “JS handler”. To do this, go to thedev/02_dev.R file! We add the following line in the “External Resources” section:
golem::add_js_handler("barchartJS")$(document).ready(function () {
Shiny.addCustomMessageHandler("barchartJS", function (arg) {
const ctx = document.getElementById("myChart");
new Chart(ctx, {
type: "bar",
data: {
labels: ["Red", "Blue", "Yellow", "Green", "Purple", "Orange"],
datasets: [
{
label: "# of Votes",
data: [12, 19, 3, 5, 2, 3],
borderWidth: 1,
},
],
},
options: {
scales: {
y: {
beginAtZero: true,
},
},
},
});
});
});
labels, label, data, and borderWidth parameters, which are hardcoded here, with the future elements passed as arguments to our handler. The notation to use here will be arg.param_name to access the values passed by our {shiny} application. The . notation is a JavaScript convention for accessing properties of an object. To draw a parallel with R, it’s somewhat like using arg$param_name.
At the beginning of our handler, we add a call to the console.log() function to check the contents of the arg element from the JS console. This will allow us to verify that the elements passed from R are correctly transmitted to our handler.
$( document ).ready(function() {
  Shiny.addCustomMessageHandler('barchartJS', function(arg) {
    console.log(arg);
    const ctx = document.getElementById('myChart');
    new Chart(ctx, {
      type: 'bar',
      data: {
        labels: arg.labels,
        datasets: [{
          label: arg.label,
          data: arg.data,
          borderWidth: arg.borderWidth
        }]
      },
      options: {
        scales: {
          y: {
            beginAtZero: true
          }
        }
      }
    });
  })
});R/app_ui.R file to generate the parameters to be passed to our handler:
arg.labelswill be a vector of 5 character strings, randomly chosen from the letters of the latin alphabet.arg.labelwill be a character string, randomly chosen from the letters of the latin alphabet.arg.datawill be a vector of 5 integer numbers, randomly chosen between 1 and 100.arg.borderWidthwill be an integer, randomly chosen between 1 and 5.
R/app_ui.R file:
app_ui <- function(request) {
    tagList(
        # Leave this function for adding external resources
        golem_add_external_resources(),
        # Your application UI logic
        fluidPage(
            h1("golemchartjs"),
            actionButton(
                inputId = "showbarplot",
                label = "Show Barplot"
            ),
            tags$div(
                tags$canvas(id = "myChart")
            )
        )
    )
}R/app_server.R file :
app_server <- function(input, output, session) {
    observeEvent(input$showbarplot, {
        app_labels <- sample(letters, 5)
        app_label <- paste0(sample(letters, 10), collapse = "")
        app_data <- sample(1:100, 5)
        app_borderWidth <- sample(1:5, 1)
        golem::invoke_js(
            "barchartJS",
            list(
                labels = app_labels,
                label = app_label,
                data = app_data,
                borderWidth = app_borderWidth
            )
        )
    })
}- The first parameter in the call to
golem::invoke_js()is the name of the JavaScript handler. - The following parameters are the elements to be passed as arguments to our handler. They should be passed in a named list where the names correspond to the elements in the
argobject of our handler.
golem::run_dev() and verify that everything works as expected!
 Congratulations! 👏
In addition to the displayed chart, we can see that the JavaScript console in the browser correctly shows the content of the
Congratulations! 👏
In addition to the displayed chart, we can see that the JavaScript console in the browser correctly shows the content of the arg object, including its 4 sub-elements: labels, label, data, and borderWidth.
And if you click the button again, what happens?
 The chart does not update; it remains stuck on the first chart! 😮
The JavaScript console indicates that the
The chart does not update; it remains stuck on the first chart! 😮
The JavaScript console indicates that the arg object has indeed been updated, but the chart does not refresh. Additionally, an error message appears in the JavaScript console: “Error: Canvas is already in use. Chart with ID ‘0’ must be destroyed before the canvas with ID ‘myChart’ can be reused.”
Let’s try to understand what’s happening: in the R/app_ui.R file, we added a canvas element with the ID “myChart” (with tags$canvas(id = "myChart")). This element is used to display the chart. When we click the “Show Barplot” button, a new chart is generated and displayed in this element. However, the previous chart is not destroyed, and the error message indicates that the “canvas” is already in use.
The application code for this step is available here: https://github.com/ymansiaux/golemchartjs/tree/step2
Why isn’t the chart updating?
To find the answer, we need to refer back to the Chart.js documentation. We can read in the “.destroy()” section that in order to reuse the HTML “canvas” element for displaying a new chart, it is necessary to destroy the previous chart. There is also a command “.update()” for updating an existing chart. This method seems more appropriate here, as we are using the same type of chart, with only a few parameters changing. The.update() method allows updating an existing chart without having to destroy and recreate it, which will be less “brutal” visually (with a chart disappearing and then reappearing). However, the .destroy() method should be kept in mind for cases where we want to radically change the type of chart, for example.
Updating a chart implies that a chart has already been generated once. Therefore, we need to modify our JavaScript handler to account for this and find a way to detect the existence of a chart on our page. For this, we will refer again to the Chart.js documentation, particularly the getChart method: https://www.chartjs.org/docs/latest/developers/api.html#static-getchart-key.
The command to use is in the following form: const chart = Chart.getChart("canvas-id");. According to the documentation, if the chart exists, the variable chart will contain the Chart.js object associated with the HTML “canvas” element. If the chart does not exist, the variable chart will be undefined.
For this command to work, we need to replace “canvas-id” with the ID of our “canvas”, which is “myChart” here: const chart = Chart.getChart("myChart");
Let’s restart our application. We indeed find that the chart object is undefined as long as the chart has not been created, and it correctly reflects this status afterwards.
 We can adapt our code as follows:
- If
chartisundefined, we create a new chart. - If
chartis notundefined, we update the existing chart.
.update() method: https://www.chartjs.org/docs/latest/developers/api.html#update-mode
$(document).ready(function () {
  Shiny.addCustomMessageHandler("barchartJS", function (arg) {
    console.log(arg);
    const ctx = document.getElementById("myChart");
    const chart = Chart.getChart("myChart");
    if (chart == undefined) {
      console.log("Creating a new chart");
      new Chart(ctx, {
        type: "bar",
        data: {
          labels: arg.labels,
          datasets: [
            {
              label: arg.label,
              data: arg.data,
              borderWidth: arg.borderWidth,
            },
          ],
        },
        options: {
          scales: {
            y: {
              beginAtZero: true,
            },
          },
        },
      });
    } else {
      console.log("Updating an existing chart");
      chart.data.labels = arg.labels;
      chart.data.datasets[0].label = arg.label;
      chart.data.datasets[0].data = arg.data;
      chart.data.datasets[0].borderWidth = arg.borderWidth;
      chart.update();
    }
  });
});
- Retrieve the Chart.js object associated with the HTML “canvas” element using the method
Chart.getChart("myChart"). - Check if this object is
undefined: if it is, use the code that has been working until now to create a new chart. - If it is not
undefined, overwrite the configuration elements you want to update and then use the.update()method. Note the specifics of handling configuration elements:chart.data.labels = arg.labelsfor the labels,chart.data.datasets[0].label = arg.labelfor the label, etc. Use.to access object properties, with each.allowing access to a deeper level of “depth”. It is also important to note that array indexing starts at 0 in JavaScript, not at 1 like in R.
 Phew, everything is OK this time! 🥲
We’ve touched on a more complex case of using a JavaScript library in a
Phew, everything is OK this time! 🥲
We’ve touched on a more complex case of using a JavaScript library in a {shiny} application. It is crucial to understand the library’s functioning by delving into the depths of its documentation. Moreover, one of the advantages of using a very popular library is that you can often find help on StackOverflow 😊 (here is an example of using the .destroy() method).
Feel free to go further in customizing your chart, such as changing the bar colors: https://www.chartjs.org/docs/latest/general/colors.html and https://www.chartjs.org/docs/latest/charts/bar.html.
The best way to learn is to try reproducing examples from the documentation.
The application code for this step is available here: https://github.com/ymansiaux/golemchartjs/tree/step3
Creating a Scatter Plot with Chart.js
We will attempt to create a scatter plot with Chart.js. To develop our code, we will rely on the Chart.js documentation: https://www.chartjs.org/docs/latest/charts/scatter.html. As before, our code will be stored in a JS handler. Therefore, we will add a new handler in thedev/02_dev.R file:
golem::add_js_handler("scatterplotJS")config, which will include the type, data, and options elements we have already seen. There is also a data element containing datasets and labels.
We will fill in the skeleton of our handler with the JavaScript code from the Chart.js documentation. Initially, we will leave out the “update” part.
$(document).ready(function () {
  Shiny.addCustomMessageHandler("scatterplotJS", function (arg) {
    const ctx = document.getElementById("myChart2");
    const data = {
      datasets: [
        {
          label: "Scatter Dataset",
          data: [
            {
              x: -10,
              y: 0,
            },
            {
              x: 0,
              y: 10,
            },
            {
              x: 10,
              y: 5,
            },
            {
              x: 0.5,
              y: 5.5,
            },
          ],
          backgroundColor: "rgb(255, 99, 132)",
        },
      ],
    };
    const config = {
      type: "scatter",
      data: data,
      options: {
        scales: {
          x: {
            type: "linear",
            position: "bottom",
          },
        },
      },
    };
    new Chart(ctx, config);
  });
});
data and options elements. Here, we store these elements in data and config variables before passing them to new Chart.
Next, we add the following to the R/app_ui.R file:
h1("Scatterplot"),
actionButton(
    inputId = "showscatterplot",
    label = "Show Scatterplot"
),
tags$div(
    tags$canvas(id = "myChart2")
)R/app_server.R file:
  observeEvent(input$showscatterplot, {
    golem::invoke_js(
      "scatterplotJS",
      list(
      )
    )
})golem::invoke_js().
Let’s run your application with golem::run_dev() and verify that everything works as expected!
 The chart from the documentation works! 🎉
Now, let’s go further by passing our own data as input.
The application code for this step is available here: https://github.com/ymansiaux/golemchartjs/tree/step4
The chart from the documentation works! 🎉
Now, let’s go further by passing our own data as input.
The application code for this step is available here: https://github.com/ymansiaux/golemchartjs/tree/step4
An example with the iris dataset
We will use theiris dataset to generate a scatter plot. We will pass as arguments to our JS handler the data from the Sepal.Length and Sepal.Width columns.
As with the bar chart, we will use elements passed from R through the arg object in JavaScript.
We modify the data object to include a legend title and, most importantly, the data. To observe the elements passed from R, we add a call to console.log().
console.log(arg);
const data = {
  datasets: [
    {
      label: arg.label,
      data: arg.data,
      backgroundColor: "rgb(255, 99, 132)",
    },
  ],
};x and y for the point coordinates.
data: [{
    x: -10,
    y: 0
  }, {
    x: 0,
    y: 10
  }, {
    x: 10,
    y: 5
  }, {
    x: 0.5,
    y: 5.5
}]Sepal.Length and Sepal.Width columns via a list. We make the following modification in R/app_server.R:
observeEvent(input$showscatterplot, {
    golem::invoke_js(
        "scatterplotJS",
        list(
            label = "My scatterplot",
            data = list(
                x = iris$Sepal.Length,
                y = iris$Sepal.Width
            )
        )
    )
}) Thanks to the
 console.log() call in our handler, we can observe the content of the arg object in the JavaScript console of the browser. We notice that the data passed is not in the correct format. Here, we get an array of two elements, the first containing the values of Sepal.Length and the second containing the values of Sepal.Width, which is not the expected format.
Here, we need to do some work on the R side to transform our data into the expected format.
If we display a JSON preview of the data we passed as input, indeed the rendering is incorrect.
jsonlite::toJSON(
  list(
    x = iris$Sepal.Length,
    y = iris$Sepal.Width
  )
)
#> {"x":[5.1,4.9,4.7,4.6,5,5.4,4.6,5,4.4,4.9],"y":[3.5,3,3.2,3.1,3.6,3.9,3.4,3.4,2.9,3.1]}{purrr} package is a top choice.
new_data <- purrr::transpose(
  list(
    x = iris$Sepal.Length,
    y = iris$Sepal.Width
  )
)
jsonlite::toJSON(
  new_data,
  auto_unbox = TRUE
)
#> [{"x":5.1,"y":3.5},{"x":4.9,"y":3},{"x":4.7,"y":3.2},{"x":4.6,"y":3.1},{"x":5,"y":3.6},{"x":5.4,"y":3.9},{"x":4.6,"y":3.4},{"x":5,"y":3.4},{"x":4.4,"y":2.9},{"x":4.9,"y":3.1}]observeEvent(input$showscatterplot, {
golem::invoke_js(
"scatterplotJS",
list(
label = "My scatterplot",
data = purrr::transpose(
list(
x = iris$Sepal.Length,
y = iris$Sepal.Width
)
)
)
)
}) This time it’s good! 😊 We can see in the JavaScript console that the data has indeed been passed in the correct format.
The application code for this step is available here: https://github.com/ymansiaux/golemchartjs/tree/step5
This time it’s good! 😊 We can see in the JavaScript console that the data has indeed been passed in the correct format.
The application code for this step is available here: https://github.com/ymansiaux/golemchartjs/tree/step5
A Little Extra Polish
Our chart still lacks titles for the axes! To find out how to do this, the documentation comes to our rescue once again: https://www.chartjs.org/docs/latest/axes/labelling.html#scale-title-configuration. We need to add atitle object to our existing scales object. Each axis, “x” and “y”, is an object within the scales object and can have a title along with its associated parameters (color, font, etc.).
We will add a title element to the x object within our scales object. Several parameters are customizable, and we will need to modify the text parameter to set the title for each axis and the display parameter to show them, as this parameter is set to false by default (note the different boolean notation between JavaScript and R: true/false VS TRUE/FALSE).
The documentation sometimes lacks examples, so we can also rely on StackOverflow: https://stackoverflow.com/questions/27910719/in-chart-js-set-chart-title-name-of-x-axis-and-y-axis. However, be careful with the version of Chart.js used, as parameters may vary.
In our JS handler, we will add an xAxisTitle parameter and a yAxisTitle parameter.
const config = {
    type: 'scatter',
    data: data,
    options: {
      scales: {
        x: {
          type: 'linear',
          position: 'bottom',
          title: {
            display: true,
            text: arg.xAxisTitle
            }
          },
        y: {
          title: {
            display: true,
            text: arg.yAxisTitle
          }
        }
      }
    }
};display: true rather than display = TRUE, for example. Confusing : with = can easily occur and result in non-functional code.
In our R/app_server.R file, we will add the xAxisTitle and yAxisTitle elements to the list passed as an argument to our handler.
observeEvent(input$showscatterplot, {
    golem::invoke_js(
        "scatterplotJS",
        list(
            label = "My scatterplot",
            data = purrr::transpose(
                list(
                    x = iris$Sepal.Length,
                    y = iris$Sepal.Width
                )
            ),
            xAxisTitle = "Sepal Length",
            yAxisTitle = "Sepal Width"
        )
    )
}) The application code for this step is available here: https://github.com/ymansiaux/golemchartjs/tree/step6
Going further with the scatter plot
Additional modifications can be made to enhance the chart:- Modify the title
- Change the fill color of the points and their border color
- Title: https://www.chartjs.org/docs/latest/configuration/title.htmlThe title should be included in a
pluginsobject, which in turn is included in theoptionsobject. - Point Colors: https://www.chartjs.org/docs/latest/charts/line.html#point-stylesThe color of the points will be managed within the
datasetsobject.
shiny inputs (which will be a good way to revisit the “update”-related issues 😉).
Below is a preview of the chart created here (without functional “update” for now):
 The handler code has been completed to account for these new elements:
$(document).ready(function () {
  Shiny.addCustomMessageHandler("scatterplotJS", function (arg) {
    const ctx = document.getElementById("myChart2");
    console.log(arg);
    const data = {
      datasets: [
        {
          label: arg.label,
          data: arg.data,
          borderColor: arg.pointBorderColor,
          backgroundColor: arg.pointBackGroundColor,
        },
      ],
    };
    const plugins = {
      title: {
        display: true,
        text: arg.mainTitle,
        color: arg.mainTitleColor,
      },
    };
    const config = {
      type: "scatter",
      data: data,
      options: {
        plugins: plugins,
        scales: {
          x: {
            type: "linear",
            position: "bottom",
            title: {
              display: true,
              text: arg.xAxisTitle,
            },
          },
          y: {
            title: {
              display: true,
              text: arg.yAxisTitle,
            },
          },
        },
      },
    };
    new Chart(ctx, config);
  });
});R/app_ui.R, elements have been added to allow the user to pass the necessary parameters:
h1("Scatterplot"),
textInput(
    inputId = "scatterplot_title",
    label = "Scatterplot Title",
    value = "ChartJS rocks !"
),
selectInput(
    inputId = "title_color",
    label = "Title Color",
    choices = c("brown", "orange", "purple"),
    selected = "brown"
),
selectInput(
  inputId = "points_background_color",
    label = "Points Background Color",
    choices = c("red", "blue", "green"),
    selected = "red"
),
actionButton(
  inputId = "showscatterplot",
    label = "Show Scatterplot"
),
tags$div(
    tags$canvas(id = "myChart2")
)R/app_server.R, we add the necessary elements to pass the parameters to our handler:
observeEvent(input$showscatterplot, {
        golem::invoke_js(
            "scatterplotJS",
            list(
                label = "My scatterplot",
                data = purrr::transpose(
                    list(
                        x = iris$Sepal.Length,
                        y = iris$Sepal.Width
                    )
                ),
                xAxisTitle = "Sepal Length",
                yAxisTitle = "Sepal Width",
                mainTitle = input$scatterplot_title,
                mainTitleColor = input$title_color,
                pointBorderColor = "black",
                pointBackGroundColor = input$points_background_color
            )
        )
}).update() method to account for updates to shiny inputs related to the title and the color of the points.
We will use the approach from the previous chart to modify our JS handler accordingly.
$(document).ready(function () {
  Shiny.addCustomMessageHandler("scatterplotJS", function (arg) {
    const ctx = document.getElementById("myChart2");
    console.log(arg);
    const chart2 = Chart.getChart("myChart2");
    if (chart2 == undefined) {
      console.log("Creating a new chart");
      const data = {
        datasets: [
          {
            label: arg.label,
            data: arg.data,
            borderColor: arg.pointBorderColor,
            backgroundColor: arg.pointBackGroundColor,
          },
        ],
      };
      const plugins = {
        title: {
          display: true,
          text: arg.mainTitle,
          color: arg.mainTitleColor,
        },
      };
      const config = {
        type: "scatter",
        data: data,
        options: {
          plugins: plugins,
          scales: {
            x: {
              type: "linear",
              position: "bottom",
              title: {
                display: true,
                text: arg.xAxisTitle,
              },
            },
            y: {
              title: {
                display: true,
                text: arg.yAxisTitle,
              },
            },
          },
        },
      };
      new Chart(ctx, config);
    } else {
      console.log("Updating an existing chart");
      chart2.data.datasets[0].backgroundColor = arg.pointBackGroundColor;
      chart2.options.plugins.title.text = arg.mainTitle;
      chart2.options.plugins.title.color = arg.mainTitleColor;
      chart2.update();
    }
  });
}); Well done! 🎉
The application code for this step is available here: https://github.com/ymansiaux/golemchartjs/tree/step8
Well done! 🎉
The application code for this step is available here: https://github.com/ymansiaux/golemchartjs/tree/step8
Modifying the tooltip (advanced level)
We will look to modify the tooltip that appears when hovering over a point on the chart. In addition to changing its title, we want to display the row number from the dataset corresponding to the hovered point, as well as the corresponding values ofSepal.Length and Sepal.Width.
Here are the resources used:
- Tooltip title: https://www.chartjs.org/docs/latest/configuration/tooltip.html#tooltip-callbacks
- Tooltip content: https://www.chartjs.org/docs/latest/configuration/tooltip.html#tooltip-callbacks and https://www.youtube.com/watch?v=anseX1ePfUw
plugins object, used previously to manage the chart title, contains a tooltip element, which in turn contains a callbacks element. It is within this element that we can modify the title and content of the tooltip. Most tooltip elements can be configured via a function call that takes a context element as input. This is a JavaScript object that contains several items related to the hovered point. We will explore the content of this object to extract the information we need later when customizing the tooltip content.
We modify our JS handler by including a fixed title (we could also have passed it as a parameter):
const tooltip = {
  callbacks: {
    title: function (context) {
      return "Tooltip title";
    },
  },
};
const plugins = {
  title: {
    display: true,
    text: arg.mainTitle,
    color: arg.mainTitleColor,
  },
  tooltip: tooltip
}; The application code for this step is available here: https://github.com/ymansiaux/golemchartjs/tree/step9
Let’s proceed with customizing the tooltip content!
In this step, we will modify the
The application code for this step is available here: https://github.com/ymansiaux/golemchartjs/tree/step9
Let’s proceed with customizing the tooltip content!
In this step, we will modify the label parameter in the tooltip object. To refine our code, we will use the debugger function, which we haven’t used so far! If you are familiar with using browser() in R, debugger is its JavaScript equivalent. It allows you to pause the code execution and open the browser console to explore the arguments passed to a function.
Let’s modify our handler:
const tooltip = {
  callbacks: {
    title: function (context) {
      return "Tooltip title";
    },
    label: function(context) {
      debugger;
    }
  },
};
const plugins = {
  title: {
    display: true,
    text: arg.mainTitle,
    color: arg.mainTitleColor,
  },
  tooltip: tooltip,
};debugger in the label function of the callbacks object. We restart our application:
 When hovering over a point on the chart, code execution is paused and the browser console opens. We can then explore the content of the
 context object passed to the label function.
We can identify the information that will be useful:
- The row number in the dataset:
context.dataIndex - The values of the point:
context.formattedValue
debugger call 😉):
const tooltip = {
  callbacks: {
    title: function (context) {
      return "Tooltip title";
    },
    label: function (context) {
      lab =
        "Line number: " +
        context.dataIndex +
        " values: " +
        context.formattedValue;
      return lab;
      },
  },
};
const plugins = {
  title: {
    display: true,
    text: arg.mainTitle,
    color: arg.mainTitleColor,
  },
  tooltip: tooltip,
};
Mission accomplished! 🚀
The code for this step is available here: https://github.com/ymansiaux/golemchartjs/tree/step10
Mission accomplished! 🚀
The code for this step is available here: https://github.com/ymansiaux/golemchartjs/tree/step10
Conclusion
After our initial foray into calling JavaScript code from R with the sweetalert2 library, we have now explored using a data visualization library. Key takeaways:- Always try to get the documentation examples working before adapting them to your application.
- Use
jsonlite::toJSON()to verify that the data passed is in the format expected by the library. - Keep in mind that sometimes you need to “update” or “destroy” objects on a web page.
- Use
console.log()ordebuggerto see the contents of a JavaScript object passed as an argument to a function.
{shiny} applications. It can be an excellent way to break new ground and offer interactive and customized charts to your users.
See you soon for new adventures! 🚀