
R Software Engineering
R, for all your projects
![]()
R is one of the languages of data science richest in statistical tools and machine learning. It is the ideal partner for your data enhancement and visualization projects.
In the last few years, R has become the lingua franca of data science, whether you’re working on a data analysis or on the deployment of a datalab.
Data analysis starts with reading and preparing the data. You might have been doing that by hand, with a spreadsheet. These days are now over, as you’ll discover the wonderful world of coding and automation. Whatever the source of your table, the size of your database, whatever the number of individuals and variables, whether your data is static or requires real-time access to a server, you can read them with R.
Whatever the data manipulation, the filtering, the calculations, the joins… it can be done in a few lines of R code. Why do that? Reproducibility! Once you have automated your data preparation processes, anyone can do it at any time, without error —this anyone being your colleagues when you are on holidays, your future trainees or apprentices… or simply your future you!

There are many ways to make your data tell a story. Just tell us what your questions are, and we will dig into the impressive amount of R libraries and tools, and be sure we will find those who fit your data science projects. Multiple factor analysis, mean comparison tests, generalized linear models (GLM), random forests (RandomForest), Gradient boost modeling (GBM), textual analysis, spatial analysis, map creation, … we know these methods by heart!
If you are already familiar with statistics method, you might want to automate them, build a package, a shiny app… be sure we will show you the best way to do it in R. And if it does not exist, we’ll create it!

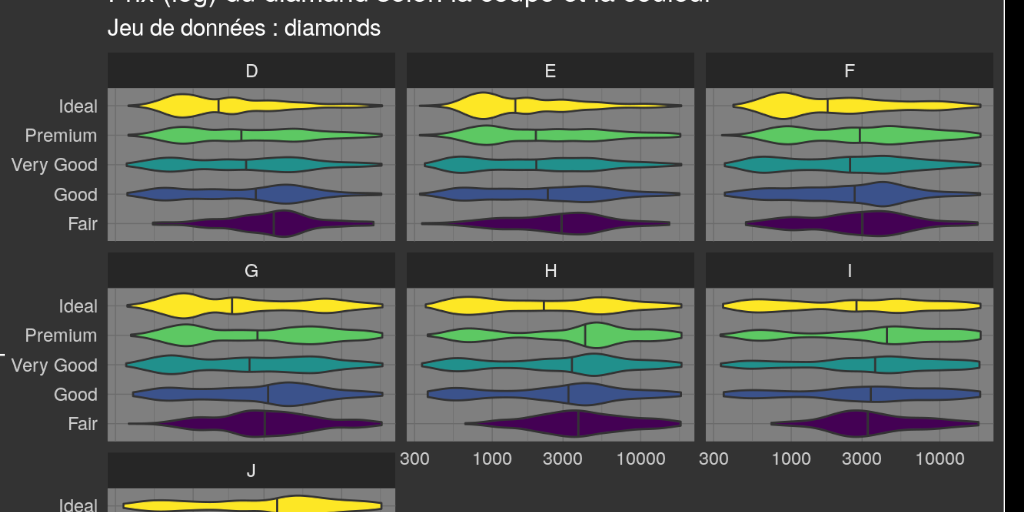
The final step of data analysis is usually presentation of the results. To do this, let’s create automated reports that you can recreate in one click when your data is updated. We can show you how to create beautiful figures with the latest fashionable packages ({ggplot2} and extensions), or even offer you interactive figures ({plotly}, {leaflet}) to put on your website.
ThinkR does all its R developments in package. That way, they are easily maintainable, ready for use and widely documented. You want to know more? Contact us !
Use cases in data science and R engineering
- Generation of automated and reproducible analysis reports
- Creation of an R package to analyse allocation of social housing
- Support in writing medical articles
- Methodological and technical support for an R datalab
- Building an experimental design tool
- Setting up a reproducible workflow
- A public Shiny app to monitor air quality in Belgium
- Development of a Shiny app and a plumber API in the bank industry
- Creation of an R package to integrate a design system in R productions
- Development of a webscraping R package and turnkey Rstudio project with {renv}
- Creation of an open-source package for the production of a git history report
- Creation of an R package for processing of image annotations
- An R package for the production of health indicators for companies
- Shiny running Python models
Contact us
A question ?
Tell us how we can help.