2018-09-16 / Marion Louveaux / data, dataviz, tidyverse
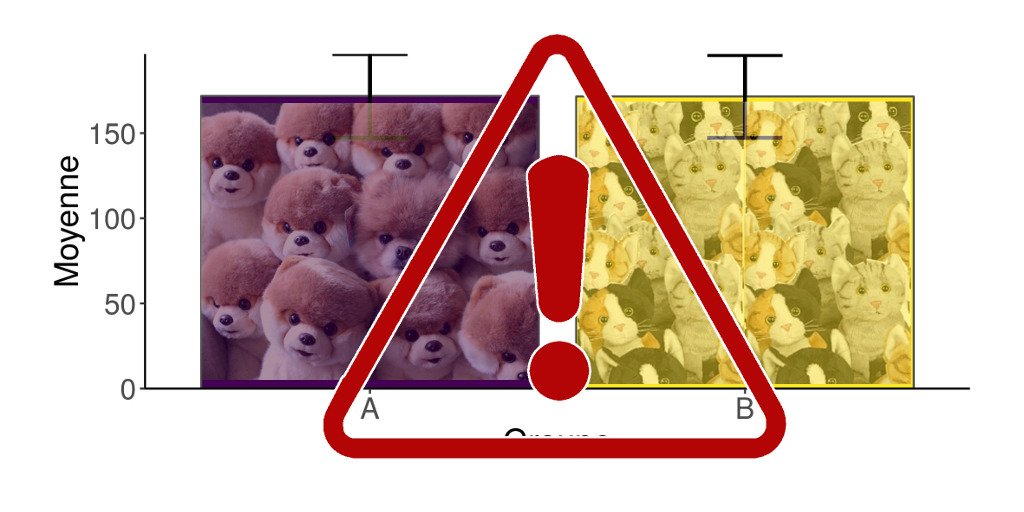
Data visualisation pitfalls: how to avoid barbarplots ?
You did an experiment or a survey, or you collected data, and you are ready to analyse them. But what is the first step? Everyone will tell you that you have to visualise your data with graphs. Yes, but how? and why? What are the common pitfalls to avoid? We are very grateful to Marion Louveaux, bio-image data analyst for ...

