2019-07-22 / Sébastien Rochette / dataviz, tips
useR!2019 Quizz: Test your knowledge of base R and ThinkR
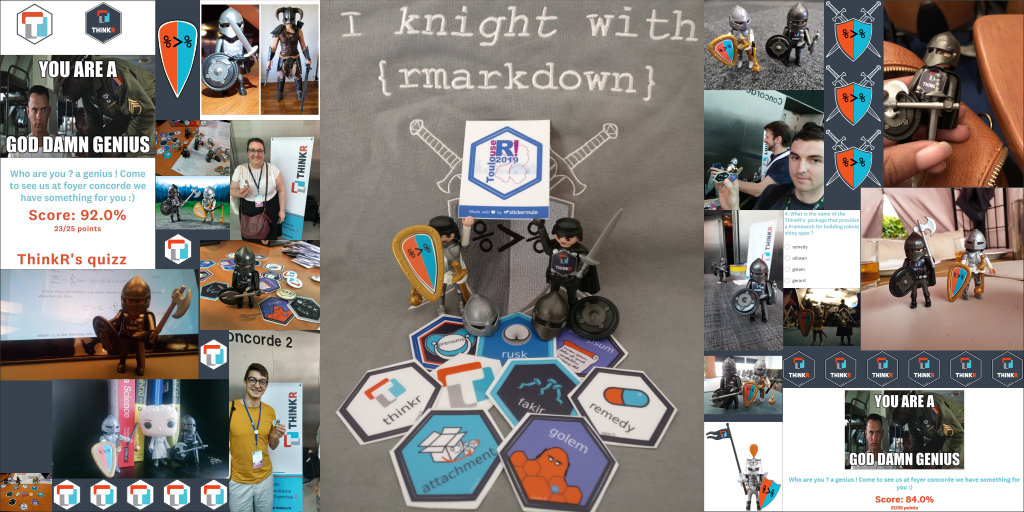
At useR!2019 in Toulouse, ThinkR opened a quizz allowing to win a pipe knight. About a hundred of respondents won this Playmobil. In this blog post, we review the questions and respondents answers. We’ll see that the crowd as almost always right, but they do not know who the real R oracle is… The quizz showed some difficulties and tricks ...