Our diligent readers already know how important having well formatted data is for efficient statistical analyses. Here we gathered some advice on how to make a well structured database, in order to perform accurate analyses, and avoid driving your fellow analysts crazy.
We are very grateful to Marion Louveaux, bio-image analyst for this translation of french version “Une base de données réussie” on our ThinkR website.
An example is worth a thousand words. Let’s imagine you are a medical intern working on an experimental assay (any resemblance to people who actually existed …). We could have given the following title to our article: “How to make a database when you are a medical intern knowing nothing”. However this exercise may have a broader application: indeed our advice applies to anyone.
Let’s say that you already have your medical question and your protocol, and that you “just” have to fill in your “database”. So, now what? As the proverb says, there are a thousand ways of doing it wrong, and often only one to do it right. Let’s be honest: if your database is not well ordered, then any further analyses will be hindered. Don’t worry, ThinkR is here to help you create a clear database. Here are ten commandments to avoid classical traps.
Note that a lot of people call a series of Excel spreadsheets a database. This is what we are talking about in this article, although it may not be the best name. For databases in the sense of SQL, commandment 1 may not be adapted, but others must be kept in mind when building database tables…
Commandment 1: all your data shall fit into one single dataframe
Table of Contents
Spreading your data over several spreadsheets or several files is not an option. All your data should fit in one single dataframe.
Commandment 2: Thou shalt respect a precise formatting
For a perfect database, follow this rule: the table must be filled cell by cell, starting from the upper left corner and, of course, without skipping line(s).

Commandment 3: A line = a statistical individual
It is not always easy to define what a statistical individual is. In a nutshell, an answer to a survey corresponds to one individual in your experimental protocol. If a physical person answers two times, you can enter these on two lines.
Commandment 4: A column = a variable
A variable corresponds to a metric from your statistical individual (e.g. a characteristic that you can measure). For instance, the gender, the age or the colour of the eyes. For these categorical variables, where each answer corresponds to one level or another, but not several levels at the same time, each variable corresponds to one column. Do not create one column for “man” and one column for “woman”, each filled with yes/no, but a single one alternating men and women accross the different lines.

When several levels can be taken by the same individual, use several columns. For instance, if your patients have several symptoms (hurting eyes/nose/neck…), you will have to create one column per symptom, and fill them with yes or no.


Commandment 5: Thou shalt not encode thy qualitative variables
Avoid as much as possible encoding qualitative variables: a 1/2 coding for the gender is useless, prefer the use of “woman” and “man” for a better readability. If you really can’t prevent yourself from using a code, then stick to 1/0 to mean presence/absence or yes/no. Not more !
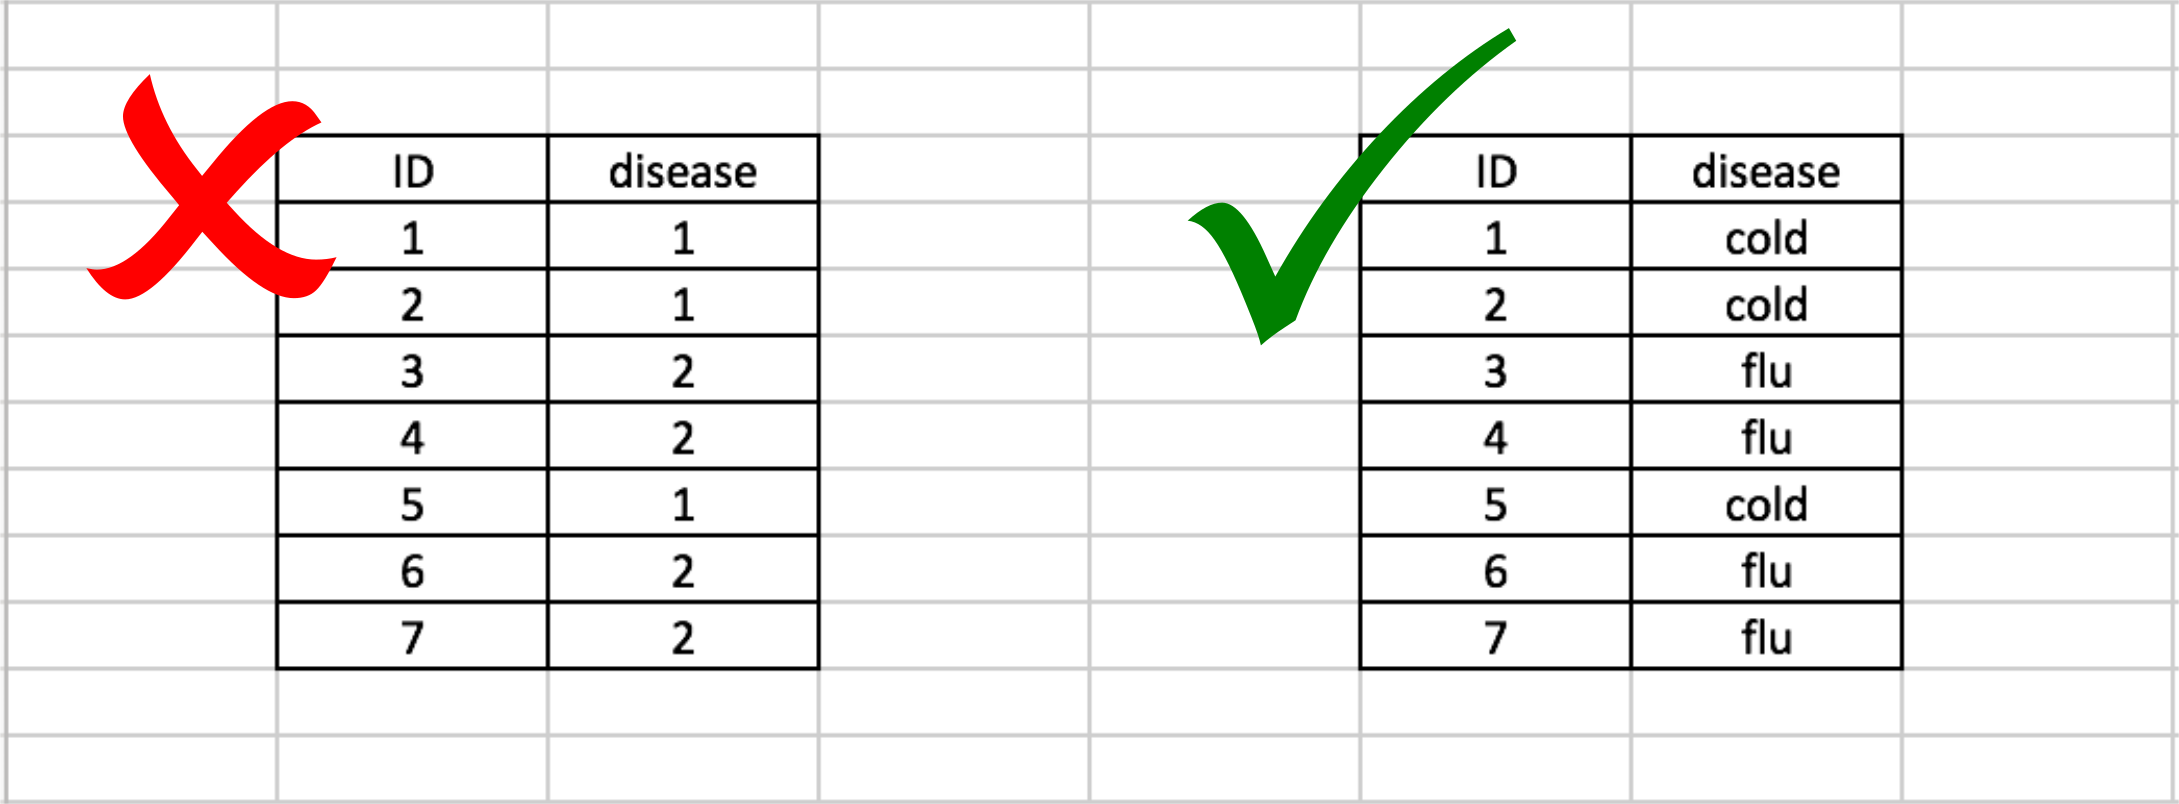
For Excel lovers: don’t code your variables using colors or bold/italic/underlined. No “control in blue, test case in red”: nothing worse than such a format to loose information when exporting those data.
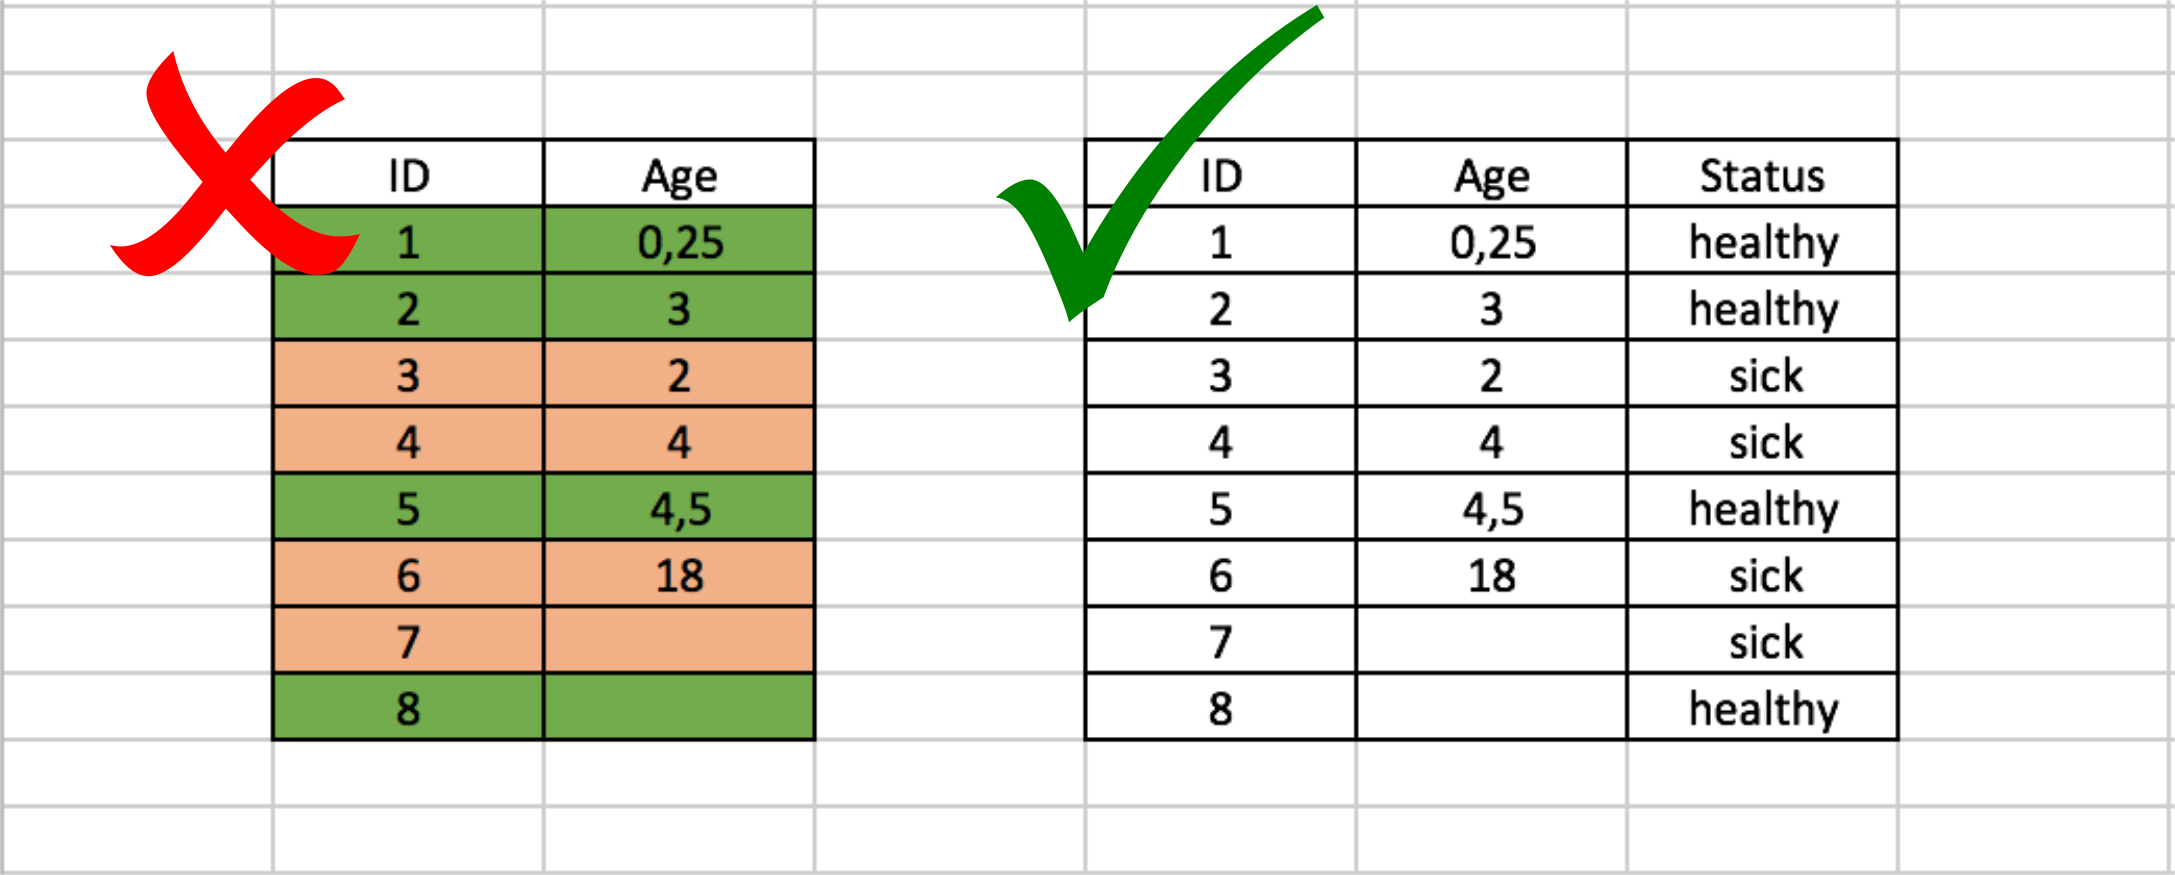
Commandment 6: Thy database shall only contain data
It is not unusual to see databases with aestethic formatting, containing titles, blank spaces, annotations, explanations and much more. Nothing is worse than this type of format for causing difficulties when importing the data into R. Repeat after me: the database must contain ONLY data.
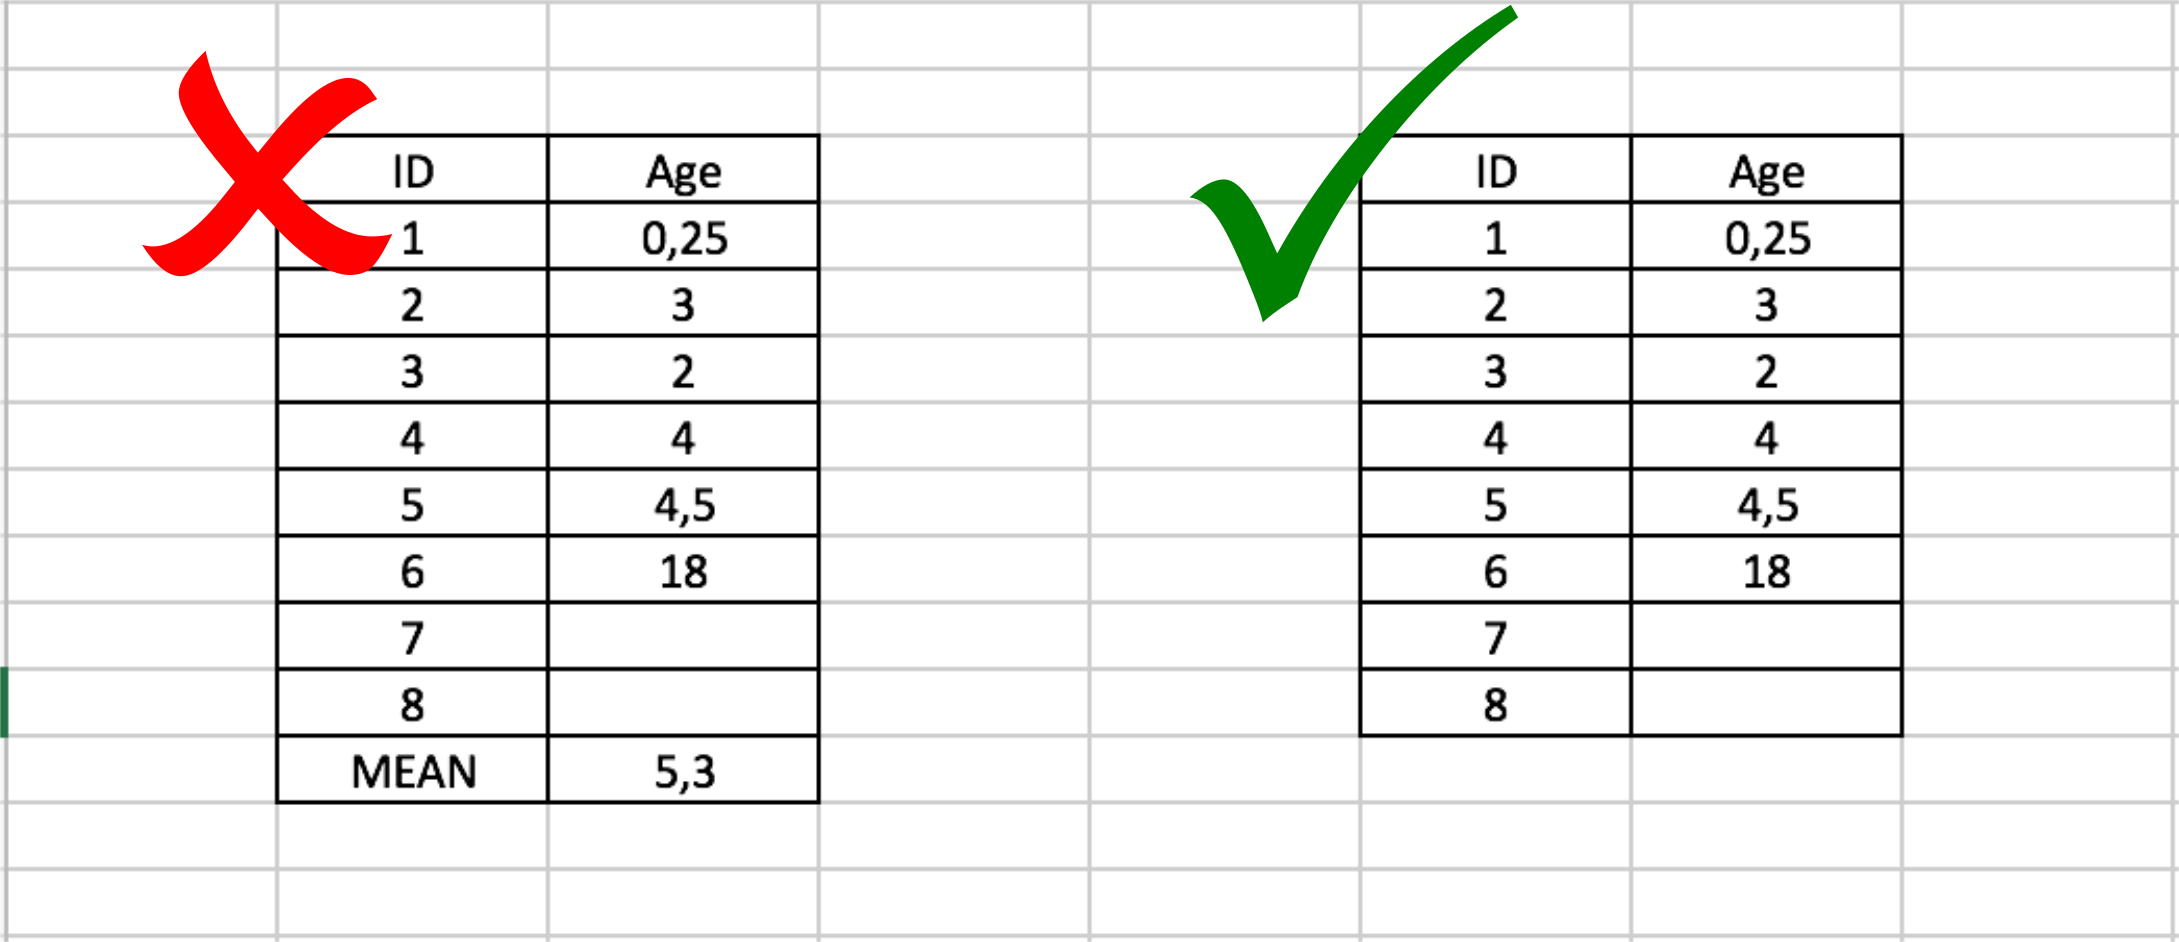
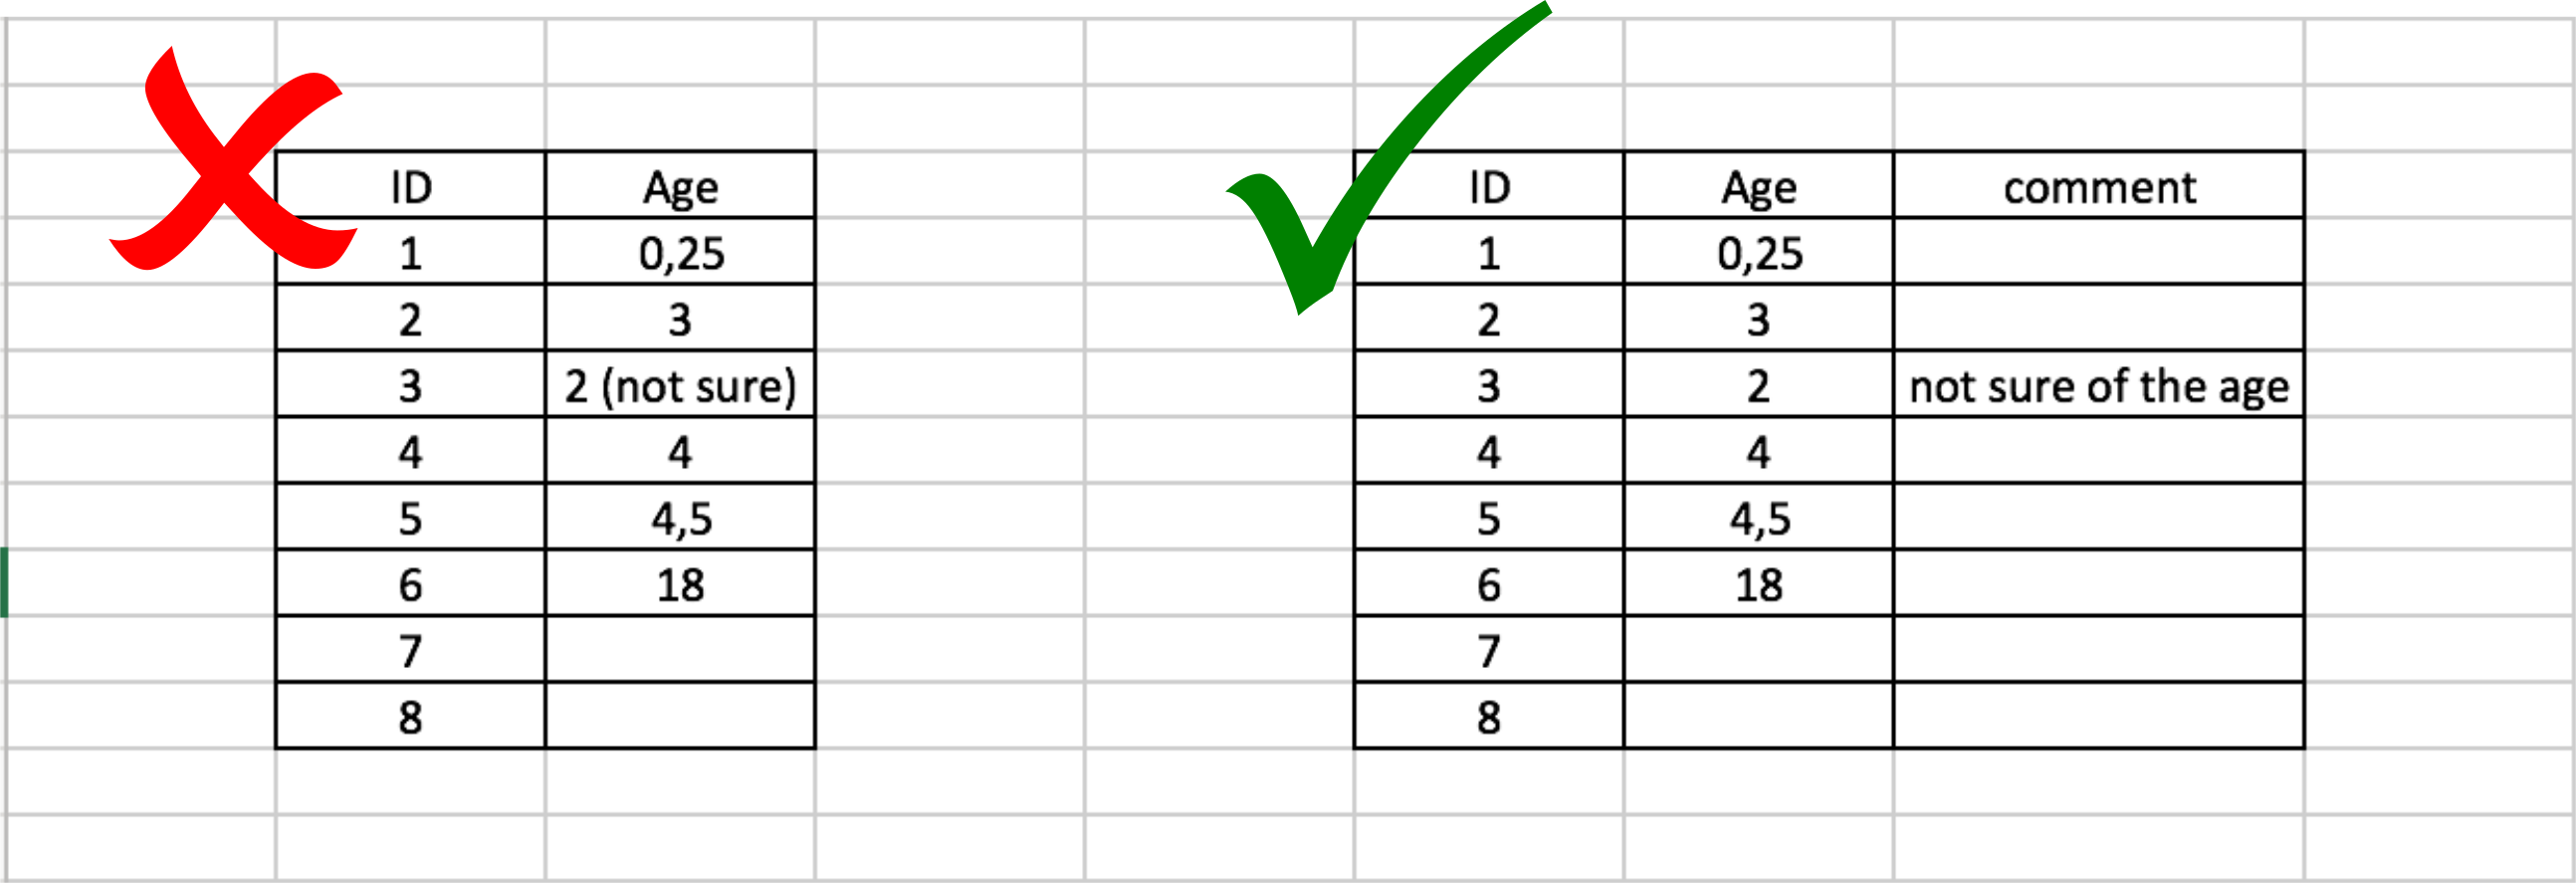
If you really need to make comments, you can always add a special column for them.
Commandment 7: Homogeneous thou shalt be
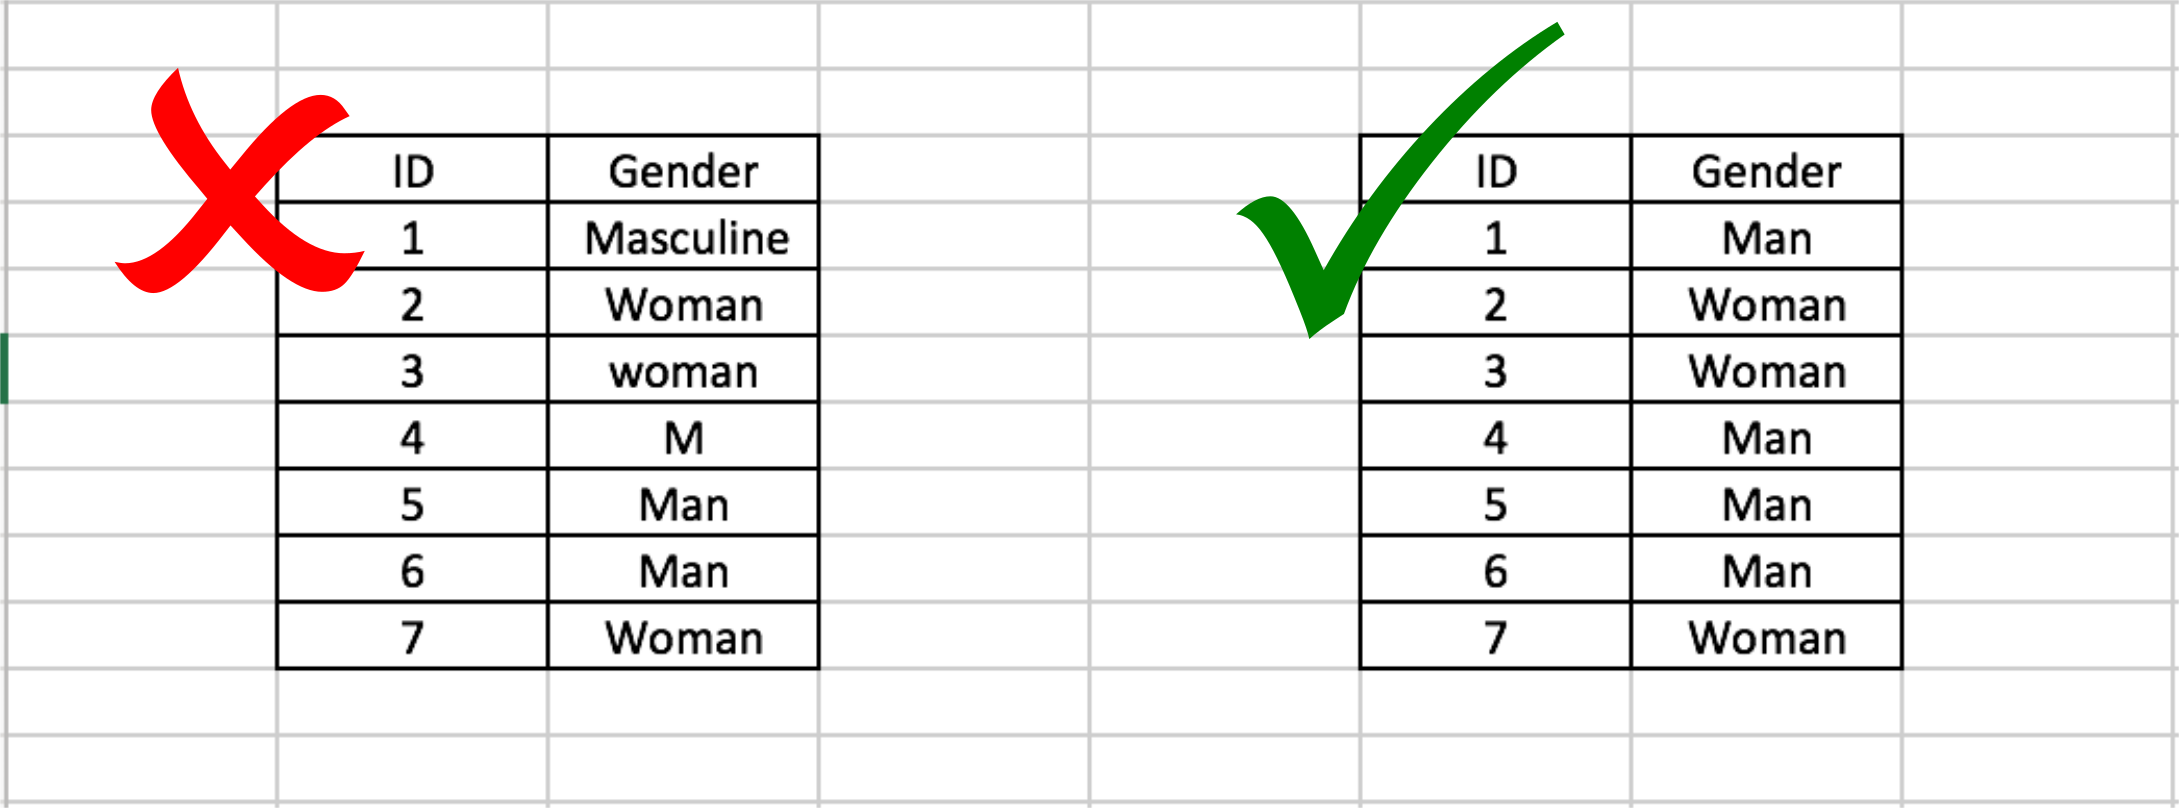
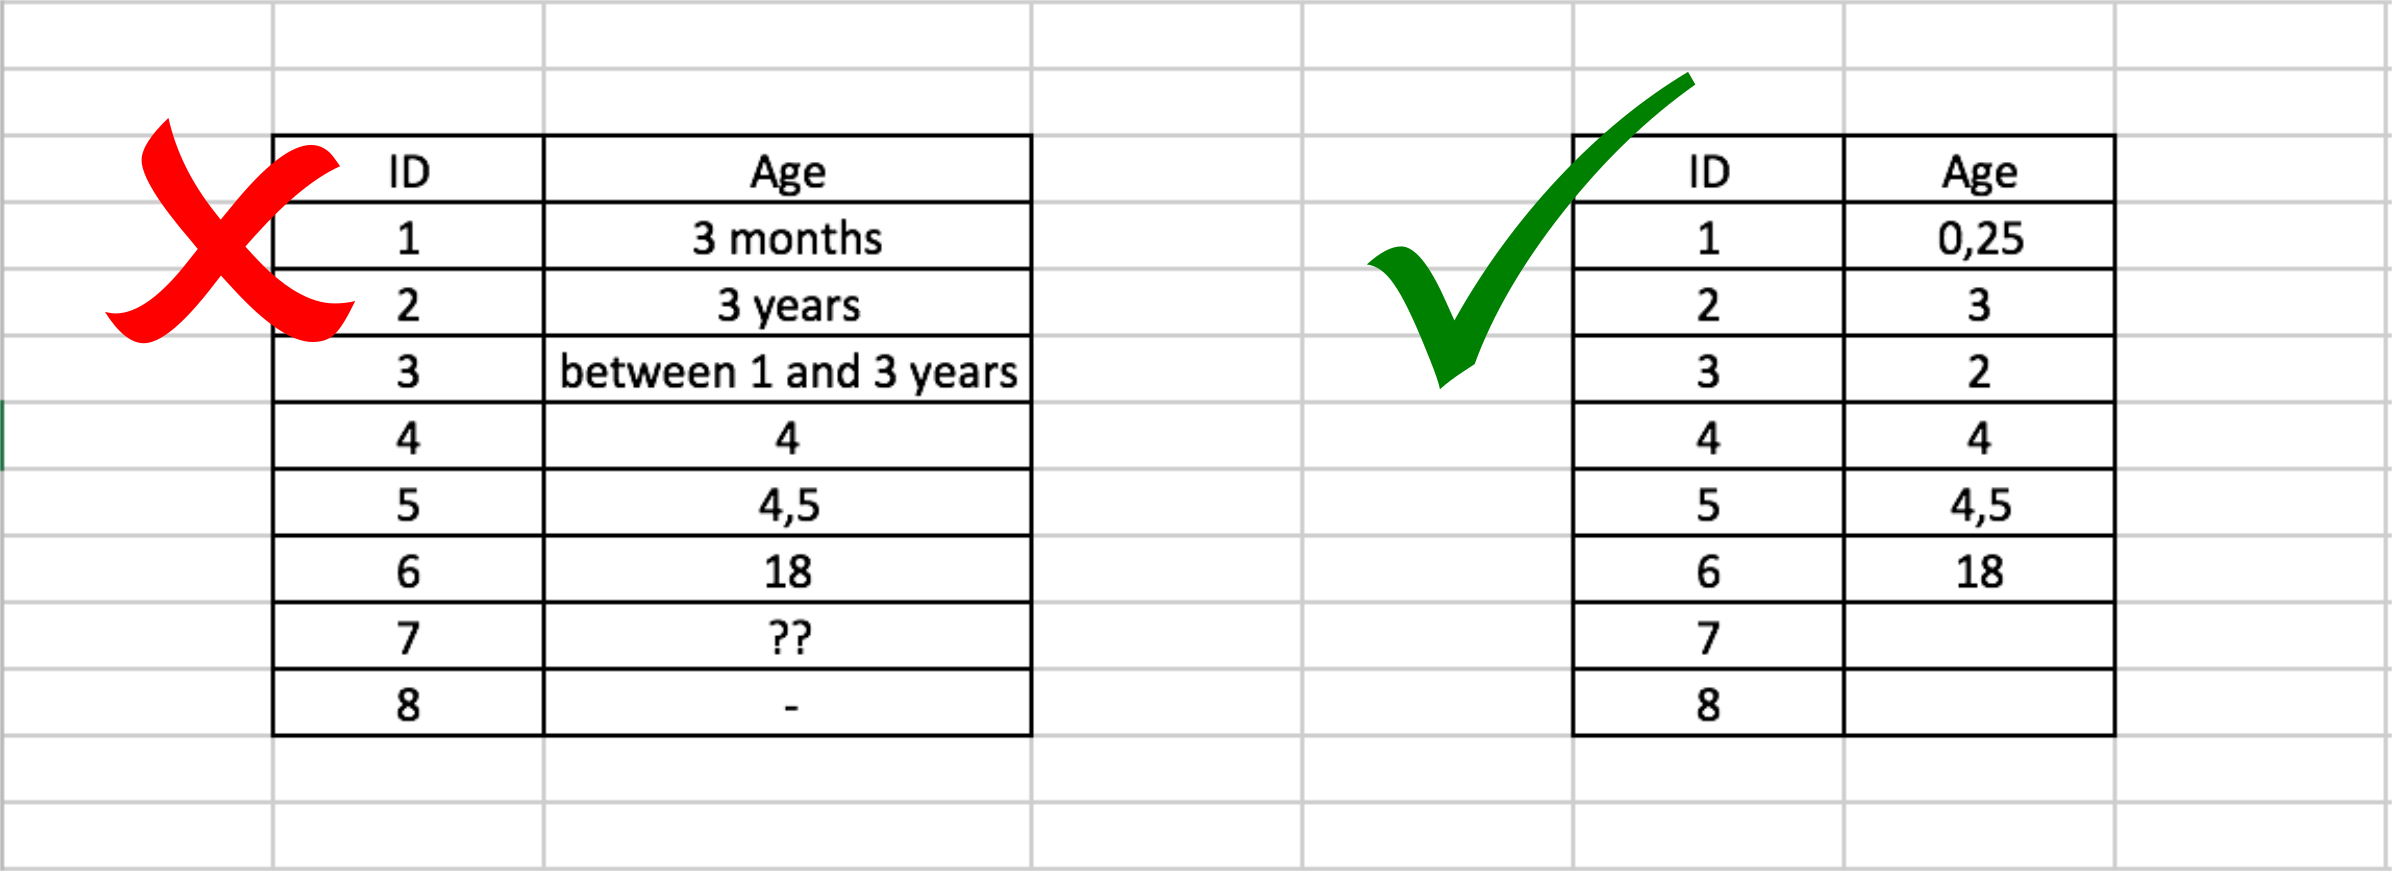
For reading, as well as for the analysis, a homogeneous notation is essential. For instance, don’t mix “boy”, “man” and “masculine”. Choose one and stick to it all across your database… including the exact spelling: R is case and blank sensitive. “Man 1” will not be the same as “man 1”, nor as “man1” or “man_1”. For column names, forget about “m1 glycemia”, “glucose rate month3” and “glycemia month6”. Rather use “glycemia_month_1”, “glycemia_month_3” and “glycemia_month_6”! When data are missing, leave a blank space.
Commandment 8: Thy numerical variables with respect thou shalt treat
You have numerical variables in your database. Fair enough, but please keep them numerical! For instance, the patient’s age must be a number, not “25 yrs” or “25 years old”, just “25”.
For the dates, choose the universal notation YYYY-MM-DD, natively recognized by R. And don’t forget to respect Commandment 7 by standardizing the format.

Commandment 9: Anonymous thy database thou shalt keep
Don’t forget to make your database anonymous (especially if you are medical intern). When communicating, sharing or publishing your results, including the identities of people is not an option. Give them numbers, and keep the correspondance in another database with the names, medical files, … and all other information that is not relevant for statistical analysis.

Commandment 10: Human readable thy database shall be
Throughout the creation of your database never forget that your data must be perfectly readable by the computer… but also by a human reader! You database must be understandable and readable, either by you or a colleague. Give meaningful names to your variables, so that you understand yourself in 6 months when reopening the database. And avoid falling into the trap of simplicity: rather use “glycemia_month1”, “glycemia_month2” and “glycemia_month3” than G1, G2 and G3.

Acknowledgements
I would like to thank Victor Jones for reviewing and correcting this translation.
Translated by Marion Louveaux, bio-image analyst
As soon as your data are clean, you can contact us for your analyses ! Although, we may help you in any data situation…


