
Diary of a rewrite, episode 2 of 4.
Translating your code line by line is the surest way to get it all wrong…
In the previous episode we told the story of why we cancelled our own stack decision halfway through, and why we went back to R. If you have not read it, no worries: this one stands on its own.
Today we are talking about the port itself. And above all about the way I got it wrong the first time.
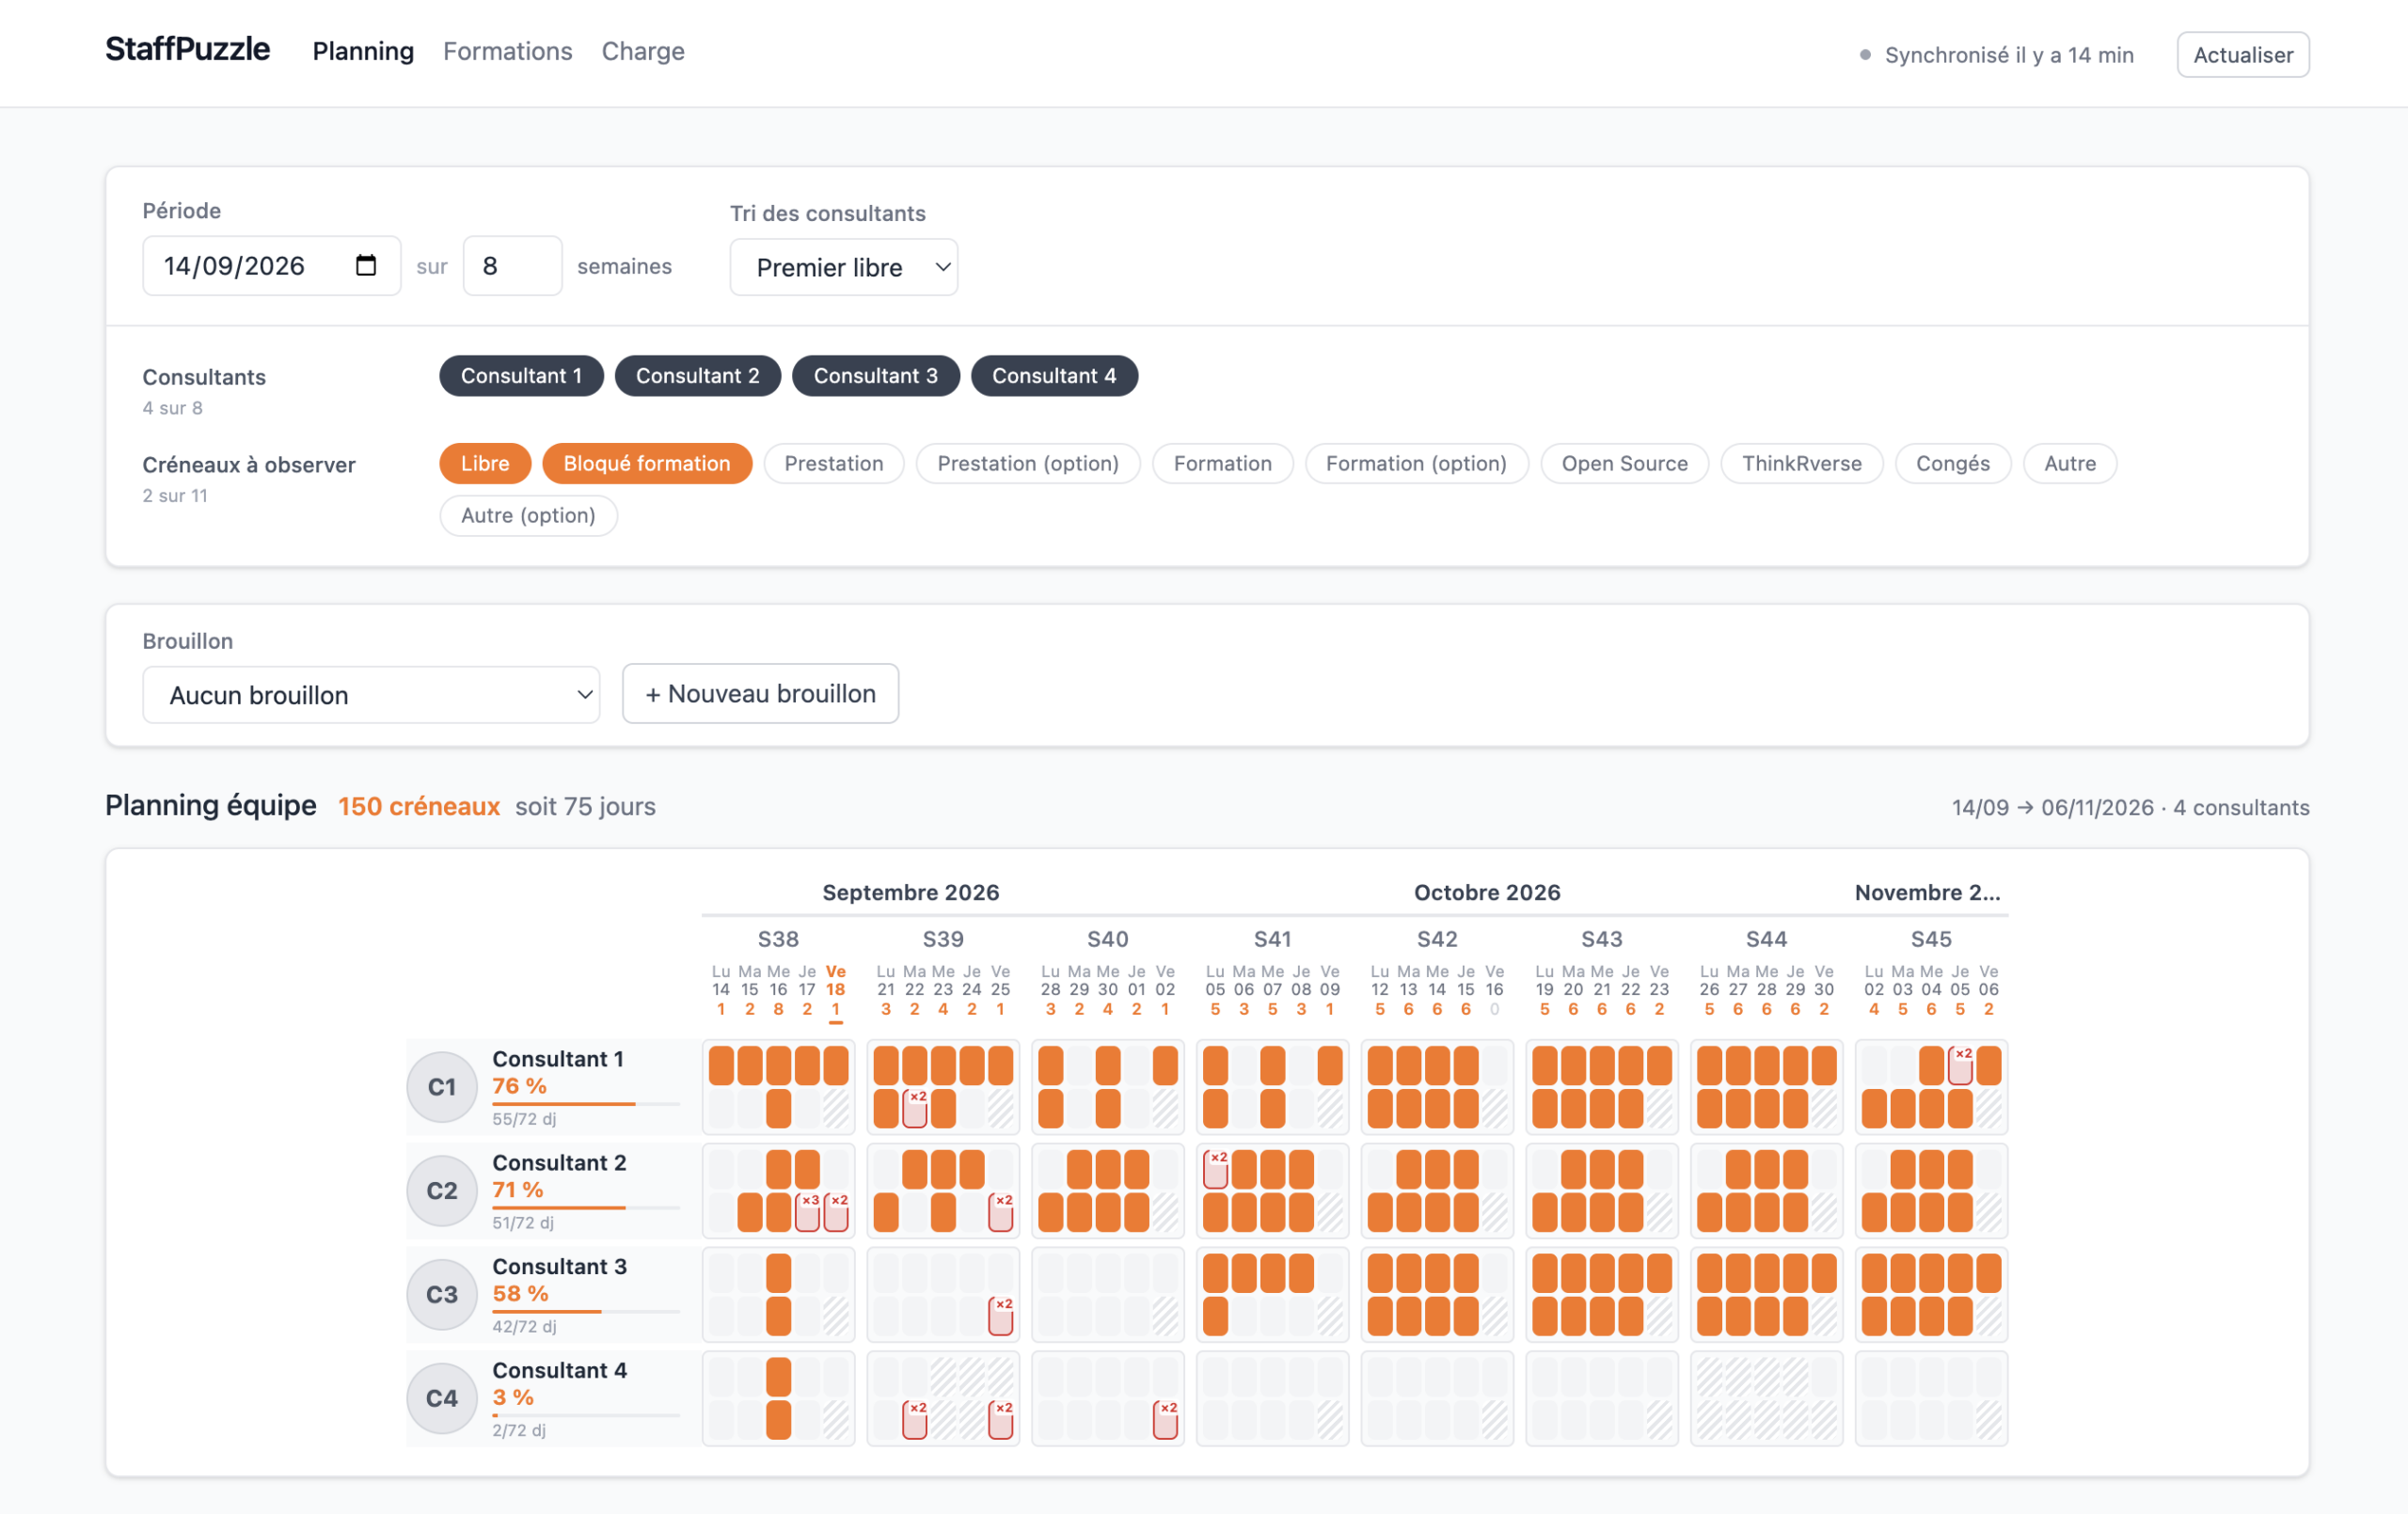
A quick bit of context. StaffPuzzle is our internal staffing tool: it says who works on what, half-day by half-day. Its Shiny version is 1,200 lines, reads the team’s Google calendars, and has been running for years. The goal was to rewrite it in htmxr, meaning HTML rendered server-side, hydrated by htmx, with plumber2 behind it.
Here is how I went about it.
I opened app_server.R, I listed every observeEvent, and I started turning them into routes. One route per observer. It is methodical, it is exhaustive… and it produces an application full of endpoints that serve no purpose.
A quick reminder: what is a route? In a classic web application, the browser asks for an address and the server sends back a response. A route is that pair: an address, and the function that builds what we send back. Where Shiny holds a continuous conversation with the browser for the whole visit, a route-based application answers requests that are independent of one another, with no memory of the previous one.
Concretely, here is the kind of translation I was doing. On the Shiny side, the observer that rebuilds the main plot whenever a filter moves (I have shortened and renamed it for readability, the original is bushier):
observeEvent(c(input$refresh, rv$slots, rv$data_ready), {
  req(rv$slots, rv$consultants, rv$start, rv$end, rv$sort_by)
  rv$filtered_slots <- rv$slots |>
    filter(member %in% rv$consultants) |>
    mark_focus(types = rv$slot_types) |>
    add_weekdays()
  rv$plot <- rv$filtered_slots |>
    team_availability_plot(
      start   = rv$start,
      end     = rv$end,
      sort_by = rv$sort_by,
      order   = rv$consultants
    )
})
And, a hundred lines further down in the same file, the output that displays it:
output$plot <- renderPlotly({
  rv$plot |> ggplotly(tooltip = "text")
})
On the routes side, it becomes an address and a function:
#* @get /plot
function(consultants, start, end, sort_by, slot_types) {
  slots |>
    filter(member %in% consultants) |>
    mark_focus(types = slot_types) |>
    add_weekdays() |>
    team_availability_plot(
      start   = start,
      end     = end,
      sort_by = sort_by,
      order   = consultants
    )
}
The browser will ask for /plot?consultants=arthur,vincent&start=2026-10-05&end=2026-11-30&sort_by=alphabetical, and the server will answer with the corresponding piece of page.
Notice in passing what has melted away on the Shiny side: I need an observer, a slot in reactiveValues to store the result, and a render* elsewhere in the file to display it. On the route side, all that is left is a function that takes arguments and returns something. That one translates well: it produces something visible, and that something can state its address.
The problem is all the others.
My mistake did not come from not knowing the destination tool. I was translating code instead of changing paradigm. And it took me several days to notice!
It is a bit like moving house. You do not pack by photographing each room so you can rebuild it identically in the new flat. You look at what you actually use, and you leave the rest at the car boot sale.
So here is what I wish someone had told me before I started.
Why inventorying the observers is the wrong entry point
Table of Contents
The reason is structural. Shiny is driven by a reactive graph, and a good share of the observers have no visible output at all. They copy a value from one place to another, they disable a button, they keep two inputs in sync. In short, they maintain the consistency of an in-memory state.
But that state does not exist in htmxr. Neither does the work of those observers. They do not translate: they disappear.
I remember the sentence I blurted out in a meeting, on 30 June, right in the middle of the port:
I feel like saying “I’ve got this or that observeEvent, so I’ve got this or that endpoint” isn’t ok. Whereas I thought starting from the data to serve is a good entry point.
It has been my working rule ever since.
Start from the data being served
An htmxr application is a set of addressable blocks of data. Every block on screen has a URL that renders it. The controls that drive it (filters, dates, sorting) are the parameters of that URL. We are in a hypermedia frame, no longer in a dependency graph.
The method comes down to 5 moves, and the order matters:
- Inventory the screens, screenshot by screenshot. Not what the code does: what the user sees.
- Cut each screen into blocks of data: header, filters, grid, detail panel.
- Give every block a URL. A block that cannot state its address is a badly cut block.
- Turn the controls into parameters.
?start=2026-10-01&n_weeks=8, not observers. - For each interaction, ask yourself a single question: is this a mutation of persistent business state?
The fifth one is the one I kept missing. Clicking a filter, changing a sort, picking a period: those are GETs, even if “something changes” on screen. Nothing is modified server-side, we are simply asking for another view of the same data.
Tip: if your inventory produces a lot of POSTs, chances are some GETs have slipped in. Go back over them.
60 lines with nothing left to do
Here is the example that tipped my understanding.
My Shiny version devoted 60 lines to keeping the URL and the inputs in sync, in both directions. Good code, by the way: that application had shareable URLs, which is not that common in Shiny.
On the Shiny side, 60 lines. Here are the two ends of it, abridged and renamed:
## Direction 1: the URL arrives, we put the inputs in the right state
observeEvent(session$clientData$url_search, {
  params <- parseQueryString(session$clientData$url_search)
  url_params$consultants <- params$consultants
  url_params$slot_types  <- params$types
  url_params$services    <- params$services
  url_params$period      <- params$period
  if (!is.null(url_params$consultants)) {
    updateSelectInput(
      session  = session,
      inputId  = "consultants",
      selected = str_to_title(
        str_split_1(str_remove_all(url_params$consultants, " "), pattern = ",")
      )
    )
  }
  ## … and the same treatment for period, slot_types and services
})
## Direction 2: an input moves, we rewrite the URL
observeEvent(
  c(input$consultants, input$slot_types, input$services,
    input$period, input$sort_by),
  ignoreInit = TRUE, {
    consultants <- str_to_lower(glue_collapse(input$consultants, sep = ","))
    slot_types  <- str_to_lower(glue_collapse(input$slot_types, sep = ","))
    period      <- glue_collapse(input$period, sep = ",")
    url <- glue("?consultants={consultants}&types={slot_types}&period={period}")
    updateQueryString(session = session, url, mode = "replace")
  })
On the htmxr side, one argument:
hx_set(
  form,
  get      = ".",
  target   = "#trainings-view",
  trigger  = "change",
  push_url = "true"
)
Careful, this is not a matter of concision. Those 60 lines have not been shortened: they have nothing left to do. They were maintaining a mirror between two representations of the same state, the URL on one side, the inputs on the other. When the URL is the state, there is simply no mirror left to hold.
Back to our house move: these are not furniture you carry up to the new flat. There is no room for them.
Want a simple test to see where you stand? If your port produces code that synchronises two things, you have kept the original paradigm. A good port deletes whole categories of code, it does not rewrite them shorter.
What happens to each building block
Once the frame is set, the port becomes mechanical. Let us look at what becomes of the blocks you have in front of you in your server.R.
A module becomes a route and a rendering function. My biggest module was 267 lines: 4 selectInput, one dateRangeInput, 6 observers, and the URL synchronisation. All that is left is an HTML form and some parameters. The ns() disappears entirely, since it only existed to avoid identifier collisions between instances. With no input binding, there is nothing left to name.
input$x becomes an argument of your function. There is no input object any more. The value arrives in the request: as a URL parameter for a GET, in the body for a POST. It is the most disorienting change in the first few days, and the most liberating one afterwards. A view function receives its inputs as arguments, so it can be tested!
output$x <- render*() becomes a function that returns HTML. The output/render pair disappears. All that is left is a function and its return value, called by a route. A renderPlot becomes a URL that serves the SVG, a renderUI a URL that serves a fragment.
updateSelectInput() becomes: nothing. We no longer update a control. The server renders the <select> in the state it should be in, and htmx swaps the fragment that contains it. The whole update*Input() family evaporates with it.
invalidateLater() becomes an attribute. A periodic refresh is written trigger = "every 15s". The browser asks for the fragment again, the server recomputes it. Nothing to invalidate, since there is no state.
showNotification() and withProgress() become a fragment, or CSS. A message is a piece of HTML returned with the response. A waiting indicator is an element that htmx shows during the request and hides afterwards. A CSS class, not R code.
reactiveValues() and session$userData become the URL, or the database. In the URL if it describes what we are looking at, in the database if it has to survive closing the tab. And if nothing is left after that sorting? Then it was plumbing state, and it goes with the rest 😉
Seeing it run
All of this stays abstract until you have it in front of you. So let us take Shiny’s canonical example, the one you get with shiny::runExample("01_hello"): the Old Faithful geyser histogram, with a slider for the number of bins.
- The application, written in htmxr. One slider, one plot, and that is all.
- The URL that serves the plot. Open it directly in your browser: you land on the SVG itself, the drawing spelled out. That is exactly what “give every block a URL” means.
Have fun changing bins=30 to bins=5, then to bins=50. The server recomputes and sends you back the drawing. No session, no state, no open conversation.
And the code, on both sides
You already know the Shiny version: it is the one from the tutorial. Here it is, stripped to the essentials.
ui <- page_sidebar(
  title = "Hello Shiny!",
  sidebar = sidebar(
    sliderInput("bins", "Number of bins:", min = 1, max = 50, value = 30)
  ),
  plotOutput("distPlot")
)
server <- function(input, output) {
  output$distPlot <- renderPlot({
    x    <- faithful$waiting
    bins <- seq(min(x), max(x), length.out = input$bins + 1)
    hist(x, breaks = bins, col = "darkgray", border = "white")
  })
}
And the htmxr version, the one running behind the link above. I have removed the Bootstrap classes, they teach you nothing.
#* @get /
#* @serializer html
function() {
  hx_page(
    hx_head(title = "Old Faithful Geyser Data"),
    hx_slider_input(
      id      = "bins",
      label   = "Number of bins:",
      value   = 30, min = 1, max = 50,
      get     = "plot",
      trigger = "input changed delay:300ms",
      target  = "#plot"
    ),
    tags$div(id = "plot") |>
      hx_set(get = "plot", trigger = "load", target = "#plot")
  )
}
#* @get /plot
#* @serializer none
function(query) {
  xmlSVG({
    x    <- faithful$waiting
    bins <- seq(min(x), max(x), length.out = as.numeric(query$bins %||% 30) + 1)
    hist(x, breaks = bins, col = "darkgray", border = "white")
  }, width = 7, height = 5)
}
Three things to look at, and they sum up the whole article.
The slider is the same object. sliderInput(id, label, min, max, value) becomes hx_slider_input(id, label, min, max, value). There is nothing to relearn.
The plot computation has not moved by a single line. The four lines of hist() are identical on both sides. That is what I had not understood when I started: it is not your business code you are porting, it is the plumbing around it.
What changes is the wiring, and it becomes visible. In Shiny, nothing says that moving the slider redraws the plot: the reactive graph works it out by itself from the presence of input$bins inside renderPlot. In htmxr, it is written on the slider itself: get = "plot" (go fetch this address), target = "#plot" (put the result there). You read the wiring instead of guessing it.
And server <- function(input, output) is gone. All that is left is two functions that take arguments and return something.
Try it yourself
No need to copy anything: the example ships with the package.
# install.packages("pak")
pak::pak("hyperverse-r/htmxr")
htmxr::hx_run_example("hello")
Your browser is waiting at http://127.0.0.1:8080. Move the slider: every move fires a request to /plot, and the server returns a new SVG. Open your browser’s network tab to watch them go by, it beats any explanation.
And if you call hx_run_example() with no argument, it lists the others: select-input, multi-select, delete-row, toast-notification, infinity-scroll, page-or-fragment, json-endpoint and reactive-values. That last one is worth a look if you are wondering what becomes of a reactiveValues() once the reactive graph is gone.
And since the plot is a URL, anyone can consume it. Here is the same application written in React, calling exactly the same R endpoint. The backend does not know who is asking, and it does not care.
This is the most underrated property of cutting things into addressable blocks: it does not lock you in. The day you want another frontend, or a mobile app, or simply for a colleague to pull your plot into their own tool, your R logic is already an API. It became one without you doing anything extra.
What costs, and what does not
Everything above is mechanical. On my port, only 3 patterns called for a real decision, and they are the ones that make an estimate vary.
| Shiny pattern | Cost | Equivalent |
|---|---|---|
selectInput, actionButton, sliderInput |
low | hx_select_input(), hx_button(), hx_slider_input() |
dateRangeInput |
low | no dedicated constructor: two <input type="date"> |
| URL ↔︎ inputs sync | low | the push_url argument |
static ggplot |
low | svglite + htmx swap |
DT (display) |
low | hx_table(), hx_table_rows() |
| long task + notifications | medium | external job + periodic polling |
interactive plotly |
high | plotly.js, or drop the interactivity |
rhandsontable |
high | JS library, or one form per cell |
The editable table has no native equivalent. Either you embed a JavaScript library, or you rebuild it with HTML fields and one save per cell. The criterion is dimensional: under twenty rows or so HTML wins, at a thousand rows with multi-cell copy-paste the library becomes the right choice again.
The interactive plot deserves a prior question, and it is precisely the one I forgot to ask myself: is it really a plot? When it is in fact a data grid, a schedule, a calendar or a heatmap, porting it as a plot is a mistake. Mine was one because Shiny made tables hard, not because the table was the right object. A real plot, on the other hand, stays an SVG served by a URL, and that is an easy case.
An opaque internal dependency is not worked around, it is isolated. You definitely have one: the homegrown package that fetches the data from somewhere, that nobody has really read in years. The temptation is to start with it, to “understand before porting”. Do not. You will spend three days on it and you will have ported nothing.
Develop everything else against a demo dataset, hard-coded, and only plug the real package in at the very end, in one go. By then you will know exactly what you want from it: a function, some arguments, a table back. And if it is still incomprehensible, call it as it is without trying to rewrite it. That is not cowardice, it is what stops it from blocking the whole port.
The most useful side effect
Shiny encourages mixing business logic and reactive orchestration: they live in the same file, often in the same function. In my v1, the rule that decides whether a slot is highlighted was computed twice, with different rules, 15 lines apart. That was not carelessness on my part, it is what a file where business and plumbing cohabit produces.
The port forces the separation. A function called by a route can no longer lean on an ambient reactive context. What is left is ordinary R, which takes data and returns data or HTML. So it can be tested.
The tests-to-code ratio went from 0.26 to 0.77: 544 tests, no browser, a few milliseconds. With the interface having become a pure function from data to HTML, it falls into the same test harness as the rest. The Shiny equivalent needs shinytest2, a headless Chrome and snapshots. It is slow, it is fragile, and it breaks when a margin moves.
Two pieces of honesty are in order here. My new version does more than the old one (writing to calendars, draft mode, historised indicators), and part of the difference in volume comes from that, not from the paradigm. And nothing stops you from testing the business logic of a Shiny application: v1 did it over 300 lines. What changes is that the interface stops being the area you never test.
What you do not get back
Let us be clear: the reactive graph does render a real service when everything depends on everything. Think of a dashboard where 6 linked plots recompute together, with cross dependencies and expensive derived values. Rebuilding that with fragments and URL parameters is possible, but you are hand-writing what Shiny gives you for free.
Hence the only decision criterion that is worth anything, to my mind: does my application’s state fit in a URL?
For mine, yes: a period, some filters, a sort. The port was a good bet. For an exploration tool where the user builds a complex working session, the answer is no, and Shiny remains the right tool. That is not a polite concession, it is the same reasoning applied to a different problem.
Conclusion
I still write Shiny, for our clients and for ourselves. This port did not prove that one technology beats another.
What it did show me is that for years I had been solving a page-rendering problem with a tool designed to hold state in memory. And that the cost of that gap stayed invisible until I had paid it once.
So before you set off, ask yourself the URL question. It will save you the few days I lost!
Do you have a Shiny application in this situation? We read it and give you back a note that says whether the port is worth it, including when the answer is no. Write to us in two lines: the size of your application, and how long it has been running.
Next week, episode 3: what leaving the managed platform cost us, bill in hand.
Diary of a rewrite, four episodes:
- We chose React to learn it. The AI wrote it for us.
- My first attempt at porting a Shiny app failed, and not for a technical reason (you are here)
- We left the managed platform. Here is the real bill. (6 October)
- Five signs your Shiny app has outgrown Shiny (13 October)
The application cited is StaffPuzzle, ThinkR’s internal staffing tool, written with htmxr, alpiner and plumber2. The figures are measured on the repository’s two branches, not estimated. Disclosure of interest: I am the author of htmxr and alpiner.