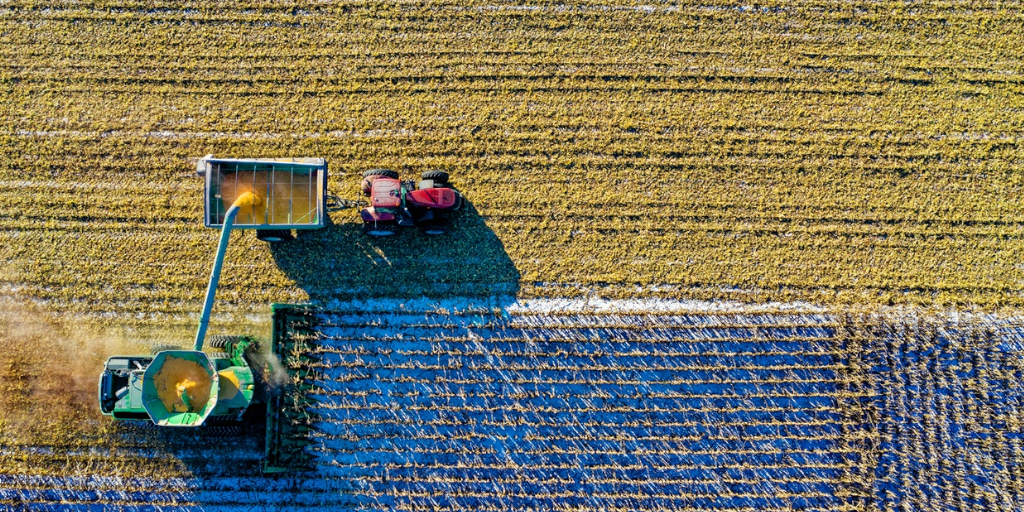
Moissonneuse batteuse en plein récolte avec un déplacement horizontal, ligne par ligne

2021-10-21 / Vincent Guyader / data, tidyverse, tips

Row-wise operations with the {tidyverse}

We are often asked how to perform row-wise operations in a data.frame (or a tibble) the answer is, as usual, “it depends” 🙂 Let’s look at some cases that should fit your needs. library(tidyverse) Let’s make an example dataset: base <- tibble::tibble( a = 1:10, b = 1:10, c = 21:30 ) %>% head() base ## # A tibble: 6 ...

2018-07-11 / Colin Fay / dataviz, tidyverse

[ggplot2] Welcome viridis !

Let’s welcome the viridis palette into the new version of {ggplot2}! Viri-what ? viridis is one of the favorite color palettes of one of the member of the team (guesswho). The viridis palette was first developed for the python package matplotlib, and has been implemented in R since. The strengths of this palette are that: plots are beautiful (which is ...

2018-07-09 / Marion Louveaux / data, database, tidyverse

The Ten Commandments for a well-formatted database

Our diligent readers already know how important having well formatted data is for efficient statistical analyses. Here we gathered some advice on how to make a well structured database, in order to perform accurate analyses, and avoid driving your fellow analysts crazy. We are very grateful to Marion Louveaux, bio-image analyst for this translation of french version “Une base de ...